This is the full developer documentation for xeol-operator
# Quick start
> Install xeol-operator with Helm and see your first results.
Four steps get you from nothing to your first scan results.
[](https://artifacthub.io/packages/helm/xeol-operator/xeol-operator)
1. Add the chart repository:
```bash
helm repo add xeol-operator https://rishang.github.io/xeol-operator
helm repo update
```
2. Install it. Pick the tab that fits your cluster: with Grafana, or with the built-in web page.
* With Prometheus and Grafana
```bash
helm install xeol-operator xeol-operator/xeol-operator -n xeol-system --create-namespace \
--set serviceMonitor.enabled=true \
--set prometheusRule.enabled=true \
--set grafanaDatasource.enabled=true
```
You need kube-prometheus-stack and Grafana’s [Infinity](https://grafana.com/grafana/plugins/yesoreyeram-infinity-datasource/) plugin.
* Without Grafana
```bash
helm install xeol-operator xeol-operator/xeol-operator -n xeol-system --create-namespace \
--set ui.enabled=true --set mcp.enabled=true
kubectl -n xeol-system port-forward deploy/xeol-operator 8080
# open http://localhost:8080/
```
3. Check that it’s scanning:
```bash
kubectl -n xeol-system get pods # READY 1/1 once the EOL database is built
kubectl -n xeol-system port-forward svc/xeol-operator-metrics 8080 &
curl -s localhost:8080/api/v1/status # images_scanned grows towards images_tracked
```
4. Optional: add vulnerability scanning with trivy.
```bash
helm upgrade xeol-operator xeol-operator/xeol-operator -n xeol-system --reuse-values --set trivy.enabled=true
```
The pod first downloads trivy’s database (\~1.6 GB). It turns Ready again once that’s done.
No authentication
The web page, MCP tools and JSON API are read-only, and they have no login. Reach them with `port-forward`. Don’t expose them through a public Ingress.
## Next steps
[Section titled “Next steps”](#next-steps)
* [Read the results](/xeol-operator/usage/#3-read-the-results).
* [Choose what gets scanned](/xeol-operator/usage/#4-choose-what-gets-scanned).
* See every chart value in [Helm setup](/xeol-operator/helm/).
# Using xeol-operator
> Install xeol-operator with Helm, read the results, and choose what it scans.
[](https://artifacthub.io/packages/helm/xeol-operator/xeol-operator)
xeol-operator finds end-of-life (EOL) software inside the images your cluster runs. Think of an old Python, a Node.js release past support, or a Debian version nobody patches any more.
It scans every running image and keeps the results current. You see them in Grafana, in Prometheus alerts, or in its own small web page.
This guide shows you how to install it with Helm, read the results, and tune what it scans. For more detail, see:
* [Helm setup](/xeol-operator/helm/#features): what each optional feature does and needs.
* [Helm setup](/xeol-operator/helm/): every Helm value.
* [Configuration](/xeol-operator/configuration/): every scan setting.
* [Air-gapped installation](/xeol-operator/air-gapped/): clusters without internet access.
## Before you start
[Section titled “Before you start”](#before-you-start)
You need:
* A Kubernetes cluster and Helm 3.
* Egress (outbound network access) from the cluster to `endoflife.date`, for the EOL data, and to the registries your images come from. No egress? Follow [Air-gapped installation](/xeol-operator/air-gapped/).
* Optional: kube-prometheus-stack (or any Prometheus Operator setup) for metrics and alerts.
* Optional: Grafana with the [Infinity](https://grafana.com/grafana/plugins/yesoreyeram-infinity-datasource/) plugin for the dashboard.
The operator image is on Docker Hub as [`rishang/xeol-operator`](https://hub.docker.com/r/rishang/xeol-operator). The chart pulls it by default, using the chart’s `appVersion` as the tag.
## 1. Install
[Section titled “1. Install”](#1-install)
Add the chart repository:
```bash
helm repo add xeol-operator https://rishang.github.io/xeol-operator
helm repo update
```
Then pick the install that matches your cluster:
* With Prometheus and Grafana
For kube-prometheus-stack:
```bash
# serviceMonitor.enabled Prometheus scrapes the EOL metrics (PromQL, history). Needs the Prometheus Operator.
# prometheusRule.enabled Alert rules: EOL software running or due soon, stale DB, failing scans. Needs the ServiceMonitor.
# grafanaDatasource.enabled Infinity datasource + dashboard, loaded by Grafana's sidecars. Needs the Infinity plugin.
helm install xeol-operator xeol-operator/xeol-operator -n xeol-system --create-namespace \
--set serviceMonitor.enabled=true \
--set prometheusRule.enabled=true \
--set grafanaDatasource.enabled=true
```
Does your Prometheus only pick up ServiceMonitors and rules with a certain label? Then add that label, for example `--set serviceMonitor.labels.release=kube-prom-stack --set prometheusRule.labels.release=kube-prom-stack`.
* Without Grafana
Use the built-in web page and MCP tools instead:
```bash
# ui.enabled Built-in web page at http:///: findings, timeline, workloads, namespaces.
# mcp.enabled Read-only MCP tools at /mcp for AI assistants (status, namespaces, workloads, findings).
helm install xeol-operator xeol-operator/xeol-operator -n xeol-system --create-namespace \
--set ui.enabled=true \
--set mcp.enabled=true
```
* From a git clone
Install the chart from source for development, or to try unreleased changes:
```bash
git clone https://github.com/Rishang/xeol-operator.git && cd xeol-operator
helm install xeol-operator ./helm/xeol-operator -n xeol-system --create-namespace
```
Add the `--set` options from the other tabs as needed.
A few more install options:
* **Both sets of options:** you can enable the Grafana and the web page options together.
* **A specific release:** add `--version `. `helm search repo xeol-operator --versions` lists the releases.
* **A specific operator version:** add `--set image.tag=`.
* **A registry mirror:** set `image.repository`. Also set `imagePullSecrets` if the mirror needs credentials.
**Add vulnerability scanning** to either install with `--set trivy.enabled=true`. Trivy then checks the same SBOM (the list of packages in the image) against its vulnerability database.
* The pod downloads that database (\~1.6 GB) before it turns Ready.
* So allow egress to `mirror.gcr.io` (or `ghcr.io`), or see [Air-gapped installation](/xeol-operator/air-gapped/#vulnerability-database-trivyenabled).
* See [Vulnerabilities (trivy)](#vulnerabilities-trivy) for what you get.
## 2. Check it’s working
[Section titled “2. Check it’s working”](#2-check-its-working)
```bash
kubectl -n xeol-system get pods # READY 1/1 once the EOL database is built
kubectl -n xeol-system port-forward svc/xeol-operator-metrics 8080 &
curl -s localhost:8080/api/v1/status
```
```json
{"images_tracked": 42, "images_scanned": 42, "workloads_eol": 7, "db_age_seconds": 180, "last_sweep": "2026-10-31T10:25:01Z", "config_error": "", ...}
```
What to look for:
* **Ready:** the pod turns Ready once the EOL database is built, about a minute after start. Scanning starts then.
* **`images_scanned`** grows towards `images_tracked`. By default, scans run one at a time and take roughly 5 to 60 seconds per image. So a large cluster takes a while on first start.
* **`last_sweep`** is set once every image has been scanned.
* **`workloads_eol`** is the number of workloads running software that is already past end of life.
* **`config_error`** stays empty while the [config file](/xeol-operator/configuration/) is valid.
Follow progress in the logs:
```bash
kubectl -n xeol-system logs deploy/xeol-operator -f | grep -E 'scanned|scan failed' # one line per image
```
## 3. Read the results
[Section titled “3. Read the results”](#3-read-the-results)
Every view shows the same data:
* each running workload,
* the EOL products found in its images,
* the EOL date,
* how many days are left (negative once past).
“Due soon” means within the chosen window. The default window is 180 days.
### Grafana
[Section titled “Grafana”](#grafana)
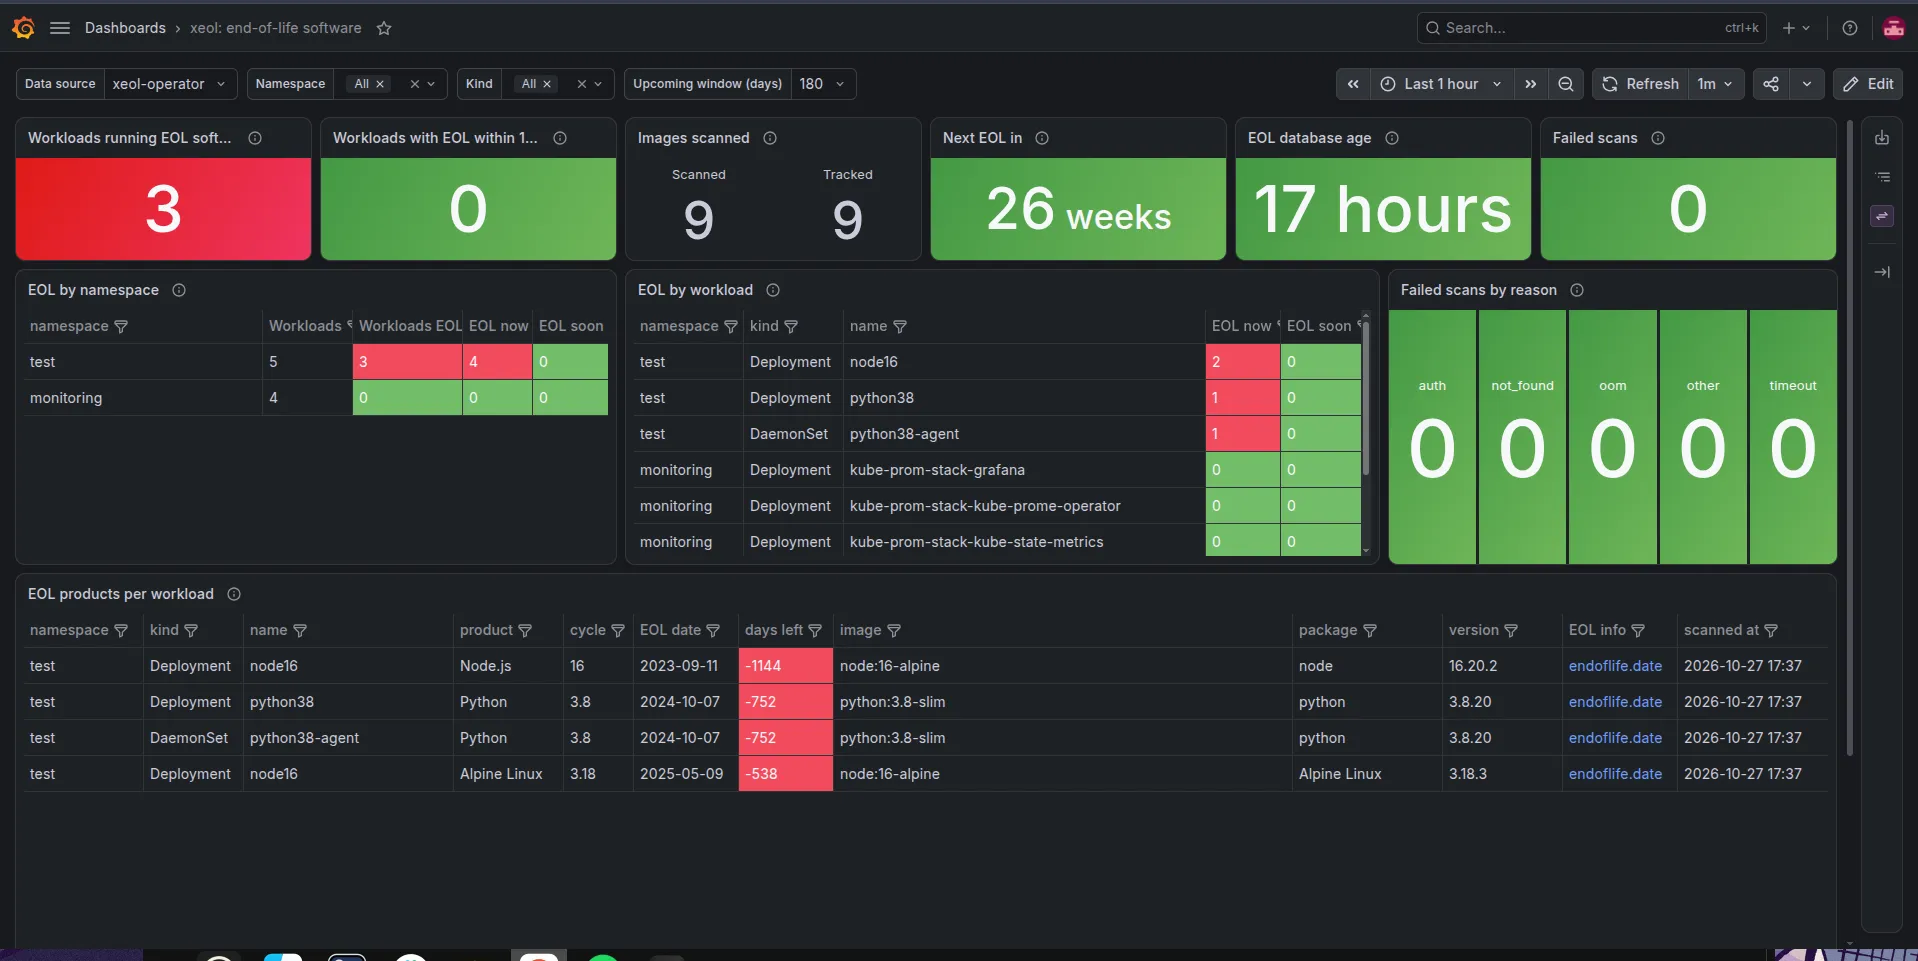
With `grafanaDatasource.enabled`, open the **xeol: end-of-life software** dashboard. It has:
* headline numbers,
* an “EOL products per workload” table (red: past EOL, yellow: due within 6 months),
* the full findings list.
Use the variables at the top to narrow by namespace and kind, or to change the “Upcoming window”.
### Built-in web page
[Section titled “Built-in web page”](#built-in-web-page)
With `ui.enabled`, start a port-forward:
```bash
kubectl -n xeol-system port-forward deploy/xeol-operator 8080
```
Then open `http://localhost:8080/`.
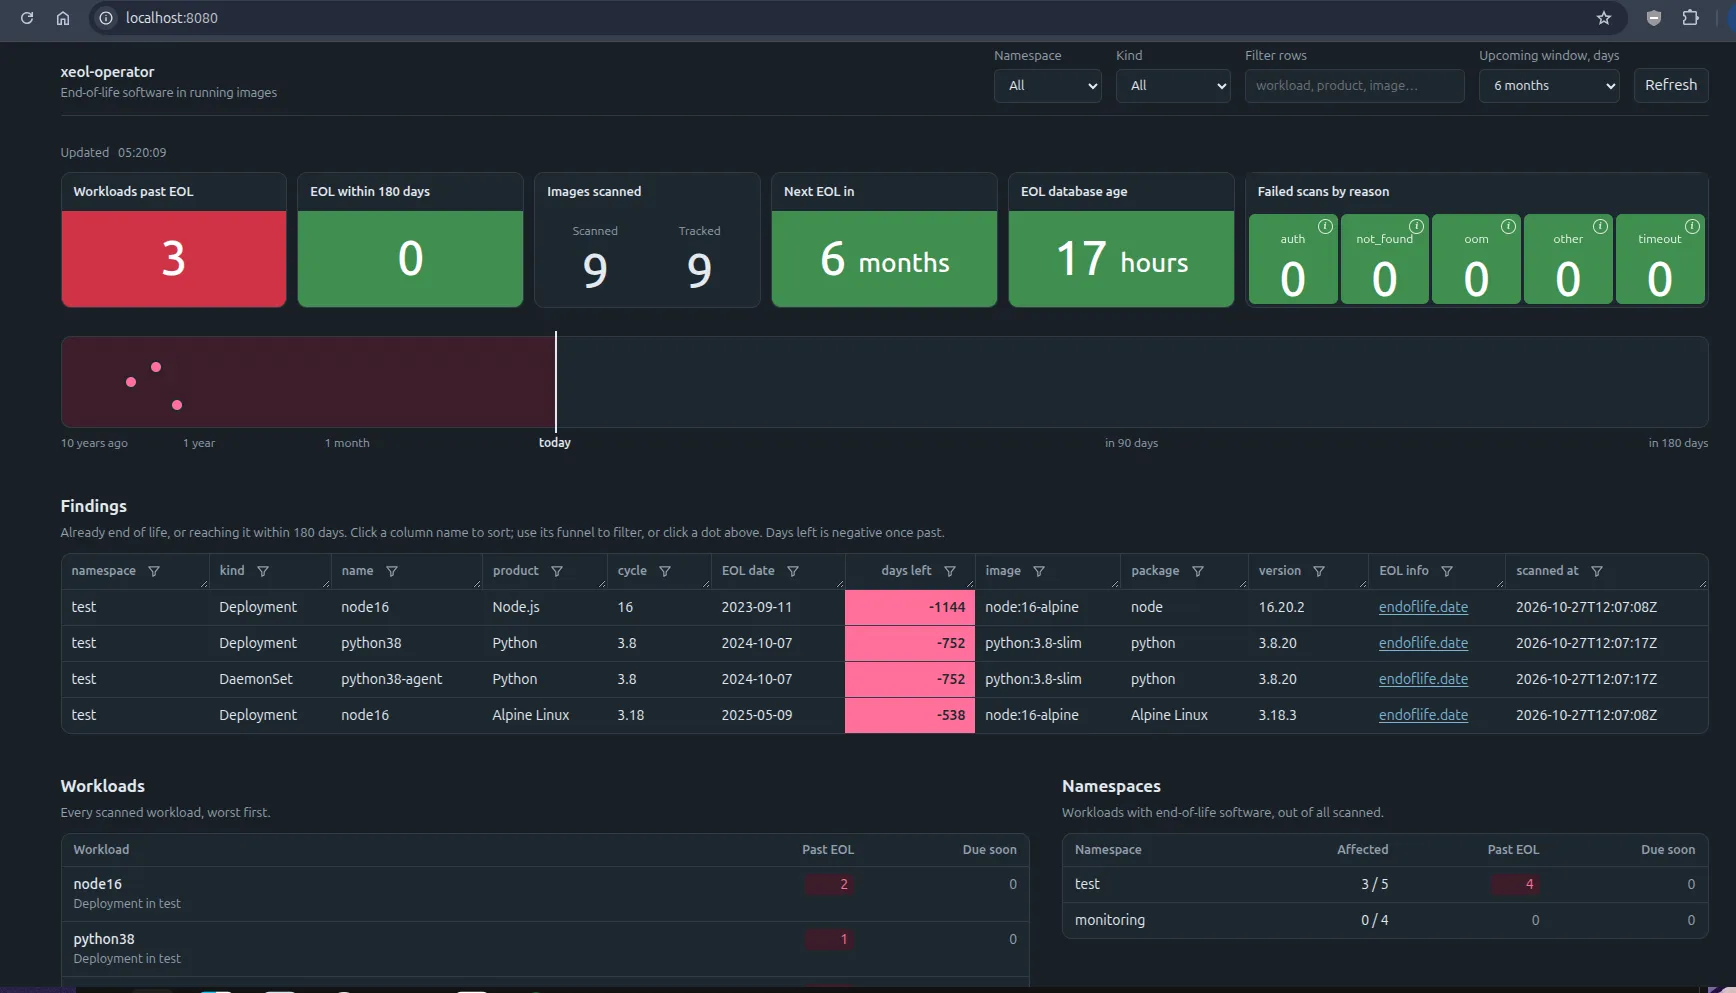
The page shows:
* **Tiles**: workloads past EOL, workloads due soon, days to the next EOL date, age of the EOL database, and failed scans by reason. Hover the ⓘ on a failure reason to see which workloads it affects.
* **Timeline**: one dot per product release, placed by EOL date. Dots left of the “today” line are already past EOL. Click a dot to filter the findings table to that release. Click it again to clear.
* **Findings table**: click a column name to sort. Use its funnel icon to filter by text or to tick specific values. Drag a header’s corner to resize a column.
* **Workloads** and **Namespaces**: counts per workload and per namespace, worst first.
The controls at the top narrow everything: Namespace, Kind, Filter rows and Upcoming window. **Refresh** reloads the data.
### Vulnerabilities (trivy)
[Section titled “Vulnerabilities (trivy)”](#vulnerabilities-trivy)
With `trivy.enabled`, the same scan also lists known vulnerabilities. The web page then gets two tabs: **EOL** and **Trivy**. With `eol.enabled=false`, it shows only the Trivy report.
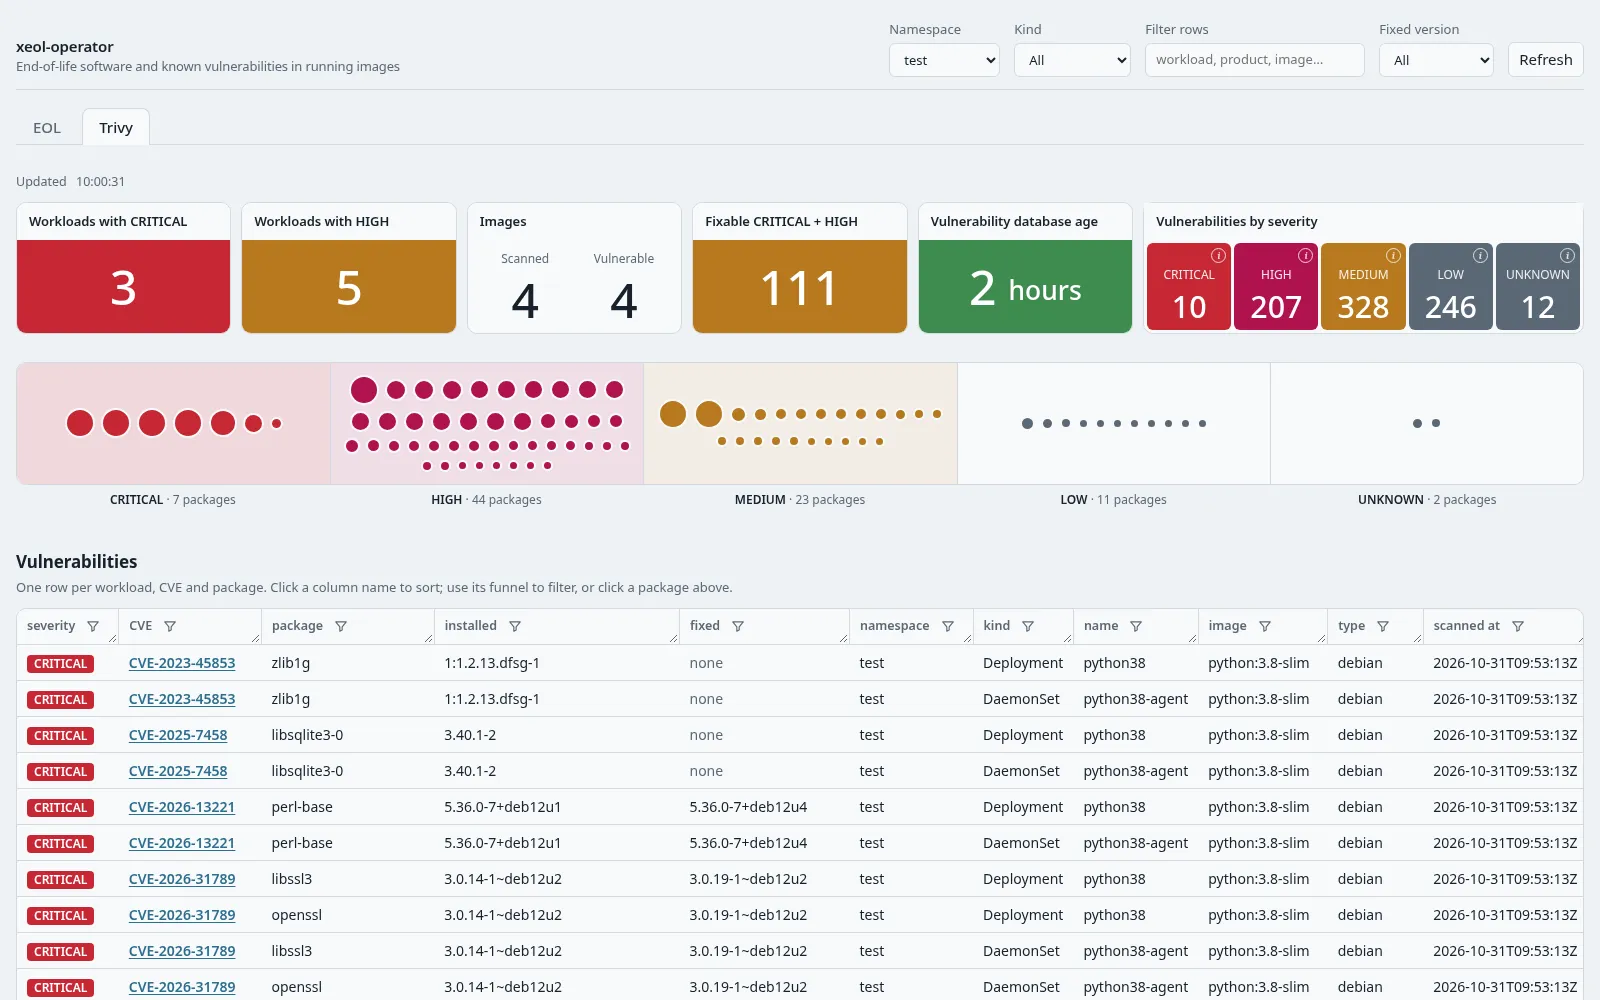
The Trivy tab shows:
* **Tiles**:
* workloads with a CRITICAL,
* workloads with a HIGH (including those that also have a CRITICAL),
* images scanned, and images with a CRITICAL or HIGH,
* CRITICAL and HIGH vulnerabilities that have a fixed version,
* the trivy database’s age,
* counts per severity.
Counts are per image. So replicas, or several workloads on one image, don’t multiply them.
* **Package strip**: one band per severity, CRITICAL on the left. Each dot is a vulnerable package. It sits in the band of its worst vulnerability and is sized by how many vulnerabilities it has. Click a dot to filter the table to that package. Click it again to clear.
* **Vulnerabilities table**: one row per workload, CVE and package, worst first. The columns are severity, CVE (linked to its advisory; hover for the title), package, installed and fixed version, then namespace, kind, name and image. It shows the first 1,000 rows. To see more, narrow it with the filters, or get every row from `/api/v1/vulnerabilities`.
* **Workloads** and **Namespaces**: CRITICAL, HIGH and fixable counts, worst first.
At the top, the **Fixed version** select replaces Upcoming window. It keeps only vulnerabilities that have a fix.
In Grafana, the `xeol: vulnerabilities (trivy)` dashboard has the same tiles and table, plus a Severity filter.
### Prometheus and PromQL
[Section titled “Prometheus and PromQL”](#prometheus-and-promql)
The operator serves metrics on port 8080 at `/metrics`. The metric’s value is the EOL date. So you decide “how soon counts” in the query:
```txt
# already past EOL
xeol_eol_date_seconds < time()
# EOL within 90 days
(xeol_eol_date_seconds - time()) / 86400 < 90
# past-EOL findings per workload: join on the image digest
sum by (namespace, kind, name) (
xeol_image_workload * on(digest) group_left count by (digest) (xeol_eol_date_seconds < time())
)
```
The full metric list is in the [README](https://github.com/Rishang/xeol-operator#metrics).
### JSON API
[Section titled “JSON API”](#json-api)
The same port serves read-only JSON. It’s handy for scripts:
```bash
kubectl -n xeol-system port-forward svc/xeol-operator-metrics 8080
curl -s 'localhost:8080/api/v1/findings?within_days=0' # already EOL
curl -s 'localhost:8080/api/v1/findings?namespace=prod&within_days=90'
curl -s localhost:8080/api/v1/status
```
**Endpoints:** `status`, `namespaces`, `workloads` and `findings`. With `trivy.enabled`, also `vulnerabilities`.
**Query parameters:**
* `namespace` and `kind`: comma-separated.
* `within_days`: default 180.
* `severity` (vulnerabilities only): comma-separated, e.g. `CRITICAL,HIGH`.
With trivy on, `status`, `workloads` and `namespaces` also include vulnerability counts.
```bash
curl -s 'localhost:8080/api/v1/vulnerabilities?severity=CRITICAL&namespace=prod'
```
### AI assistants (MCP)
[Section titled “AI assistants (MCP)”](#ai-assistants-mcp)
With `mcp.enabled`, AI assistants can read the same four views as read-only MCP tools at `/mcp`. Vulnerabilities aren’t an MCP tool yet. With the port-forward running, add the server:
```bash
claude mcp add --transport http xeol http://localhost:8080/mcp
```
Then ask, for example, “which workloads in prod run software that is already end of life?”
With `mcp.allowRescan` as well, the assistant gets a `rescan` tool too; see [Rescan now](#8-rescan-now).
No authentication
The web page, JSON API and MCP have no authentication. Reach them through `kubectl port-forward`. Don’t expose port 8080 through a public Ingress or LoadBalancer.
## 4. Choose what gets scanned
[Section titled “4. Choose what gets scanned”](#4-choose-what-gets-scanned)
You set scan settings in Helm values under `scanner.*`. The chart writes them to the [config file](/xeol-operator/configuration/), which is the ConfigMap `xeol-operator-config`. Put them in a values file:
```yaml
# my-values.yaml
scanner:
namespaceSelector: # only namespaces with this label; {} = all
matchLabels: {xeol-scan: "true"}
excludeNamespaces: ["kube-*", "monitoring"]
excludeImages: ["*/busybox*"] # globs on the image name
workloadKinds: [Deployment, StatefulSet, DaemonSet] # default also includes Job and CronJob
workloadLabels: [team] # adds a team label to metrics, for routing alerts
interval: 24h # rescan each image this often
```
```bash
helm upgrade xeol-operator xeol-operator/xeol-operator -n xeol-system --reuse-values -f my-values.yaml
```
In globs (wildcard patterns), `*` matches anything, including `/`. `?` matches one character.
Changes apply without a restart:
* The operator reloads the file once the kubelet updates it, usually within a minute.
* You can also edit the ConfigMap directly: `kubectl -n xeol-system edit configmap xeol-operator-config`. But a later `helm upgrade` overwrites it from your values.
* A typo or bad value is rejected, and the previous config stays. See [Errors](/xeol-operator/configuration/#errors).
## 5. Accept a known finding
[Section titled “5. Accept a known finding”](#5-accept-a-known-finding)
Sometimes you know about an EOL product and accept it. Maybe it’s a test environment, or software you can’t replace yet. Hide it with `ignoreProducts`.
The image is still scanned. The finding just disappears from metrics, alerts, the dashboard and the web page.
```yaml
scanner:
ignoreProducts:
- products: [perl] # everywhere in namespace "test"
namespaces: [test]
- products: [python] # only Python 3.8, only in the batch team's workloads
cycles: ["3.8"]
selector: {matchLabels: {team: batch}}
```
Use each product’s [endoflife.date](https://endoflife.date) name, e.g. `python`, `nodejs`, `debian`. Not sure of the name? The `url` on each finding links to the product’s page, which shows it.
With `trivy.enabled`, accepted vulnerabilities work the same way with `ignoreVulnerabilities`, by CVE ID and/or package:
```yaml
scanner:
ignoreVulnerabilities:
- ids: [CVE-2024-1234] # this CVE everywhere
- packages: [libcrypto3] # this package, only in namespace "test"
namespaces: [test]
```
See [Ignoring vulnerabilities](/xeol-operator/configuration/#ignoring-vulnerabilities).
## 6. Get alerted
[Section titled “6. Get alerted”](#6-get-alerted)
With `prometheusRule.enabled`, the chart installs these alerts:
| Alert | Fires when |
| ------------------------ | ------------------------------------------------------------------------- |
| `XeolEOLSoftwareRunning` | A running image contains software past EOL. |
| `XeolEOLSoftwareSoon` | Software reaches EOL within `prometheusRule.eolSoonDays` (default 90). |
| `XeolDatabaseStale` | The EOL database is older than `prometheusRule.dbStaleDays` (default 30). |
| `XeolDatabaseMissing` | The operator has no EOL database. |
| `XeolScanErrors` | Images fail to scan. |
Route them in Alertmanager as usual. Want each team to get its own findings? Set `scanner.workloadLabels: [team]`, then join on `xeol_image_workload`.
## 7. Private registries
[Section titled “7. Private registries”](#7-private-registries)
Do your Pods already pull from a private registry with `imagePullSecrets`? Then there’s nothing to set up.
Here’s how it works:
* Each scan reads the pull secrets of the Pod running the image, plus those of the Pod’s ServiceAccount. This is the same thing the kubelet does.
* It reads each Secret from the API server when the scan starts.
* It writes the credentials to a `0600` file that only that scan’s `syft` and `xeol` can see.
* It deletes the file afterwards.
* Credentials are never cached or logged.
What works:
* **Secrets of type `kubernetes.io/dockerconfigjson`** (and the older `kubernetes.io/dockercfg`) in the Pod’s namespace. They must be referenced from the Pod’s `imagePullSecrets` or its ServiceAccount’s. Several secrets are merged, and the one for the image’s registry is used.
* **Any registry that accepts those credentials**: Docker Hub, GHCR, GitLab, Harbor, Artifactory, ECR, ACR, GCR/Artifact Registry.
What doesn’t:
* **Pulls that don’t use a Secret.** Some nodes pull with a cloud identity: the EKS node role, IRSA, AKS kubelet identity, GKE node service account, or a kubelet credential provider. That works for the kubelet, but the operator can’t see that identity. Those images fail with `reason="auth"`. To fix it, give the workload’s ServiceAccount an `imagePullSecrets` entry, or add the images to `excludeImages`.
* **Short-lived tokens that nobody refreshes.** An ECR token in a Secret expires after 12 hours. Keep refreshing the Secret, with the usual CronJob or controller. The next scan reads the new one. A scan that fails with `auth` is retried after an hour.
Does an image have no pull secret? Create one and attach it to the ServiceAccount the workload uses:
```bash
kubectl -n payments create secret docker-registry regcred \
--docker-server=registry.example.com --docker-username= --docker-password=
kubectl -n payments patch serviceaccount default -p '{"imagePullSecrets":[{"name":"regcred"}]}'
```
To see which images fail on credentials, check `xeol_scan_errors_total{reason="auth"}` or the failure tiles on the web page.
For this to work, the operator needs `get` on Secrets in every namespace. The chart grants it, and the operator never lists Secrets. If that’s too broad for your cluster, skip those images with `excludeImages`.
Does the operator’s own image come from a private registry? Then set `imagePullSecrets` in the chart values. That’s a separate setting, for the operator’s pod.
## 8. Rescan now
[Section titled “8. Rescan now”](#8-rescan-now)
Each image is rescanned `interval` (default 24h) after its last scan. To get fresh results sooner, for example after you’ve updated an image or accepted new EOL data, queue a rescan yourself. Nothing restarts, and the databases are not refreshed.
From inside the operator’s pod:
```bash
kubectl -n xeol-system exec deploy/xeol-operator -- /manager rescan # every running image
kubectl -n xeol-system exec deploy/xeol-operator -- /manager rescan 'python:3.8*' 'registry.internal/*'
```
```text
queued 2 image(s) for a rescan:
python:3.8-slim
registry.internal/team/app:v1
```
* The globs use the same syntax as `excludeImages`. They match the image as written in the Pod spec (`python:3.8-slim`) or its repository (`docker.io/library/python`). Quote them so your shell doesn’t expand `*`.
* Rescans go through the normal scan queue. An image already queued or being scanned isn’t scanned twice, and an image skipped after an out-of-memory kill stays skipped.
* Follow progress in `/api/v1/status` or the logs.
**Who can do this:** anyone allowed to `exec` into the operator’s pod. The command talks to the operator over a loopback-only port (`127.0.0.1:8082`), so nothing new is reachable from outside the pod.
**From an AI assistant:** set `mcp.allowRescan=true` (with `mcp.enabled`) to add a `rescan` tool with the same optional image globs. It’s off by default, because the MCP endpoint has no authentication: anyone who reaches port 8080 could then queue rescans. The cost is bounded, at most one extra scan of each image at a time.
## Troubleshooting
[Section titled “Troubleshooting”](#troubleshooting)
**A workload is missing.** Check three things:
* Its namespace isn’t excluded.
* Its top-level kind is in `scanner.workloadKinds` (e.g. Deployment, not ReplicaSet).
* Its image isn’t excluded.
Images loaded straight onto nodes have no registry digest. They can’t be scanned, so they’re skipped.
**No findings, but I know something is old.** The operator only detects products that endoflife.date tracks. “No findings” means nothing *known* is EOL, not that nothing is.
**Failed scans.** `xeol_scan_errors_total` and the web page’s failure tiles give the reason:
| Reason | Meaning | Fix |
| ----------- | ---------------------------------------------------------- | -------------------------------------------------------------------------------------------------------------- |
| `auth` | The registry refused the pull. | Check the Pod’s (or its ServiceAccount’s) `imagePullSecrets`; see [Private registries](#7-private-registries). |
| `not_found` | The image digest is no longer in the registry. | Usually harmless. It goes away when the workload is redeployed. |
| `timeout` | The scan took longer than `scanner.timeout` (default 10m). | Raise `scanner.timeout`. |
| `oom` | The image needed more memory than the pod has. | Raise `resources.limits.memory` and `scanner.goMemLimit` together, e.g. `2Gi` and `1600MiB`. |
| `other` | Anything else. | See the operator’s logs. |
An image that fails with `oom` is skipped for 24 hours.
**High `db_age_seconds` or `XeolDatabaseStale` alert.** The daily database rebuild is failing. Usually `endoflife.date` is unreachable. Meanwhile, the operator keeps using the last good database. Check egress, or switch to a mounted database ([Air-gapped installation](/xeol-operator/air-gapped/)).
**Pod not Ready.** The pod waits for the first database build. Check the logs for errors fetching `endoflife.date`.
## Upgrade and uninstall
[Section titled “Upgrade and uninstall”](#upgrade-and-uninstall)
To upgrade:
```bash
helm repo update
helm upgrade xeol-operator xeol-operator/xeol-operator -n xeol-system --reuse-values
```
A new pod rescans everything from scratch. Coming from a chart version with the `XeolScanner` CRD? See [Upgrading from the XeolScanner CRD](/xeol-operator/configuration/#upgrading-from-the-xeolscanner-crd).
To uninstall:
```bash
helm uninstall xeol-operator -n xeol-system
```
# Configuration
> The scan config file: which images get scanned, how often, what to ignore, live reload and errors.
[](https://artifacthub.io/packages/helm/xeol-operator/xeol-operator)
One YAML file controls what the operator scans. With it you decide:
* which running images are scanned,
* how often they are rescanned,
* which workload labels end up on the metrics,
* which findings you accept and want hidden.
The Helm chart builds this file from your `scanner.*` values. It stores it in the ConfigMap `xeol-operator-config` and mounts it at `/etc/xeol-operator/config.yaml`. That path is what the operator’s `--config` flag points to.
To change it, run `helm upgrade` or edit the ConfigMap. The operator reloads the file in place. No restart is needed.
Some settings are not in this file: workers, memory, timeout, databases and scan types. They control how scans run, and they are operator flags set by Helm. Changing them needs a pod restart anyway.
## Fields
[Section titled “Fields”](#fields)
Every field is optional. With an empty or missing file, the operator scans every running image of the default workload kinds, in every namespace, once a day. The chart’s defaults also add `excludeNamespaces: [kube-*]`.
| Field | Type | Default | Behaviour |
| ----------------------- | ----------------- | ---------------------------------------------------- | ---------------------------------------------------------------------------------------------------- |
| `namespaceSelector` | LabelSelector | all namespaces | Scan only Pods in namespaces whose labels match. |
| `excludeNamespaces` | \[]string (globs) | none | Namespaces to skip. An exclude always wins. |
| `excludeImages` | \[]string (globs) | none | Images to skip. |
| `interval` | duration | `24h` | Time from a successful scan of a digest to its next scan. |
| `workloadKinds` | \[]string | `[Deployment, StatefulSet, DaemonSet, Job, CronJob]` | Top-level workload kinds to scan. |
| `ignoreProducts` | \[]rule | none | Accepted findings to hide; see [Ignoring products](#ignoring-products). |
| `ignoreVulnerabilities` | \[]rule | none | Accepted vulnerabilities to hide (trivy); see [Ignoring vulnerabilities](#ignoring-vulnerabilities). |
| `workloadLabels` | \[]string | none | Workload label keys to copy onto `xeol_image_workload` as `k8s_label_`. |
More detail on each field:
* **`namespaceSelector`**: both `matchLabels` and `matchExpressions` work.
* **`excludeNamespaces`**: checked before `namespaceSelector`, so an excluded namespace is never scanned.
* **`excludeImages`**: each glob is matched two ways. First against the image as written in the Pod spec (`python:3.8-slim`). Then against the resolved repository (`docker.io/library/python`).
* **`interval`**: failed scans retry after 1h. If an image’s scan OOM-killed the operator (ran it out of memory), that image waits 24h. A zero or negative value means 24h.
* **`workloadKinds`**: kinds are matched exactly. A Pod’s kind is its top owner: Pod → ReplicaSet → Deployment, or Job → CronJob. So Pods owned by other operators, such as `Prometheus` and `Alertmanager`, are skipped. So are bare Pods. Set `[]` to scan every kind. Add e.g. `Rollout` for Argo Rollouts.
* **`workloadLabels`**: labels come from each top-level workload (Deployment, StatefulSet, CronJob, …). Any character other than `[a-zA-Z0-9_]` becomes `_`. So `app.kubernetes.io/part-of` becomes `k8s_label_app_kubernetes_io_part_of`.
### What each field is for
[Section titled “What each field is for”](#what-each-field-is-for)
* **`namespaceSelector`**: scan only what you opt in. Label the namespaces you want scanned (`kubectl label ns payments xeol-scan=true`), then select them. Use it to roll out team by team, or to skip sandboxes.
* **`excludeNamespaces`**: skip namespaces you don’t own or can’t change, such as `kube-*`, `monitoring` and `cert-manager`. Their images are vendor-managed. They would only add findings nobody acts on.
* **`excludeImages`**: skip images that can’t be scanned or don’t matter. Examples: huge images that run out of memory, images from a registry the operator can’t reach, and `busybox`-style helpers.
* **`interval`**: trade fresh results against how much scanning you do. Images are scanned by digest, so their contents never change. A rescan only picks up new EOL data. `24h` matches the daily database rebuild. Lower it only if you need new EOL dates sooner.
* **`workloadKinds`**: keep findings to the workloads your teams deploy. The default skips Pods owned by operators (`Prometheus`, `Alertmanager`, …) and bare Pods. Add your own kinds, e.g. `Rollout` for Argo Rollouts, or set `[]` for everything.
* **`ignoreProducts`**: accept a finding you’ve decided to live with. It stops alerting and stops cluttering the dashboard. The image is still scanned. You can narrow a rule by cycle, namespace or workload labels.
* **`workloadLabels`**: route and group findings by owner. `[team]` puts `k8s_label_team` on `xeol_image_workload`. Alerts can then go to each team’s channel, and dashboards can group by team.
### Glob syntax
[Section titled “Glob syntax”](#glob-syntax)
`excludeNamespaces`, `excludeImages`, `ignoreProducts[].namespaces` and `ignoreVulnerabilities[].namespaces` take globs. A glob is a pattern with wildcards. Only two characters are special:
* `*` matches any run of characters, **`/` included**. So `registry.internal/*` matches both `registry.internal/app` and `registry.internal/team/app`.
* `?` matches exactly one character.
The whole value must match. `kube-*` matches `kube-system`, but not `my-kube-test`.
Every string is a valid glob. Any other character, such as `[` or `.`, matches itself.
## Changes apply live
[Section titled “Changes apply live”](#changes-apply-live)
1. Change `scanner.*` and run `helm upgrade`. Or edit the ConfigMap directly:
```bash
kubectl -n xeol-system edit configmap xeol-operator-config
```
2. The kubelet updates the mounted file, usually within a minute. This works because the ConfigMap is mounted without `subPath`.
3. The operator checks the file every 5 seconds. When it changes, the operator applies it and logs `config file reloaded`. Then it re-checks every Pod straight away:
* Newly excluded images drop out of the metrics on the next scrape.
* Newly included images are queued for a scan.
* Ignore rules apply at export time, with no rescan.
You need no pod restart, no rollout and no reloader. A Helm upgrade that only changes `scanner.*` doesn’t restart the pod either.
kubectl edits and the next helm upgrade
Helm owns the ConfigMap, so a hand edit doesn’t last:
* **Helm 4:** the next `helm upgrade` after a `kubectl edit` fails with `conflict with "kubectl-edit"`. Add `--force-conflicts` and your values win, which drops the hand edit.
* **Helm 3:** the upgrade quietly replaces the edit whenever `scanner.*` changes.
Use `kubectl edit` to try something out. Then move the change into your values.
### Errors
[Section titled “Errors”](#errors)
The operator parses the file strictly. Any of these is an error:
* an unknown field, such as the typo `intervall`,
* a bad duration,
* a label selector that doesn’t parse.
What happens next depends on when the error shows up:
* **At startup**, a bad file stops the operator, with the error in its log. It doesn’t guess and scan anyway. The pod shows `CrashLoopBackOff` until you fix the ConfigMap.
* **On a later edit**, the operator keeps its current config. It logs `config file rejected; keeping the previous config` with the error, and reports it as `config_error` in `/api/v1/status`. The next good file clears it.
Tip
Check a change before you apply it. `helm template` renders the file from your values. If the operator rejects it, its log shows the exact error.
## Ignoring products
[Section titled “Ignoring products”](#ignoring-products)
Some findings are known and accepted. Think of a vendor image on an old Debian, or a legacy service with a planned upgrade. `ignoreProducts` hides them from the metrics, alerts, JSON API and dashboards.
Ignored images are still scanned. If you remove a rule, its findings come back on the next scrape, with no rescan.
```yaml
ignoreProducts:
- products: [perl] # required: endoflife.date slug or display name, case-insensitive
namespaces: [test] # optional: namespace globs
- products: [gorilla]
selector: # optional: the workload's own labels
matchLabels: {app.kubernetes.io/name: grafana}
- products: [python]
cycles: ["3.8"] # optional: only these release cycles
```
| Rule field | Meaning | Empty means |
| ------------ | -------------------------------------------------------------------- | --------------- |
| `products` | The product’s endoflife.date slug or display name. Case-insensitive. | (required) |
| `cycles` | Release cycles, as shown in the `cycle` label (`3.8`, `12`). | every cycle |
| `namespaces` | Namespace name globs, same syntax as `excludeNamespaces`. | every namespace |
| `selector` | Label selector on the workload’s own `metadata.labels`. | every workload |
About `products`:
* The slug is the last part of the product’s endoflife.date page: `nodejs`, `gorilla`, `rhel`.
* The display name is what the dashboard shows: `Node.js`, `Gorilla Toolkit`, `Red Hat Enterprise Linux`.
* Spaces inside a name are kept, so `[Gorilla Toolkit]` works as written.
About `selector`: it matches the labels of the Deployment, DaemonSet, StatefulSet or CronJob itself (or a bare Pod’s labels). It does not match the Pod template’s labels.
A rule applies to a workload when both `namespaces` and `selector` match. A rule with neither applies everywhere.
**Images shared between workloads.** The EOL metric has one series per image digest, not per workload. That affects scoped rules:
* In the JSON API and dashboard tables, a scoped rule hides the finding from the matching workloads’ rows.
* In `xeol_eol_date_seconds` (and the alerts built on it), the finding drops only when *every* workload running that image matches.
Example: `python:3.8-slim` runs in `test/python38` and `prod/api`. The rule `{products: [python], namespaces: [test]}` doesn’t remove it from the metric. It still alerts, because of `prod/api`.
An invalid selector rejects the whole file (see [Errors](#errors)). The previous config stays in effect.
## Ignoring vulnerabilities
[Section titled “Ignoring vulnerabilities”](#ignoring-vulnerabilities)
With `trivy.enabled`, `ignoreVulnerabilities` does for vulnerabilities what `ignoreProducts` does for EOL findings. Use it for a CVE you’ve assessed and accepted, or a package that is known noise.
It hides them from `xeol_vulnerabilities`, `/api/v1/vulnerabilities`, the vulnerability counts in status, workloads and namespaces, the web page’s Trivy tab and the Grafana trivy dashboard. Images are still scanned, and removing a rule brings the vulnerabilities back with no rescan.
```yaml
ignoreVulnerabilities:
- ids: [CVE-2024-1234] # this CVE, in any package, everywhere
- packages: [libcrypto3] # every vulnerability in this package...
namespaces: [test] # ...only in these namespaces (globs)
- ids: [CVE-2024-5678]
packages: [zlib] # both given: this CVE in this package only
selector: # optional: the workload's own labels
matchLabels: {team: legacy}
```
| Rule field | Meaning | Empty means |
| ------------ | ------------------------------------------------------------------------------------------------------ | --------------- |
| `ids` | Vulnerability IDs as trivy reports them: `CVE-2024-1234`, `GHSA-...`. Case-insensitive. | any ID |
| `packages` | Package names as trivy reports them (the `package` column): `libcrypto3`, `openssl`. Case-insensitive. | any package |
| `namespaces` | Namespace name globs, same syntax as `excludeNamespaces`. | every namespace |
| `selector` | Label selector on the workload’s own `metadata.labels`. | every workload |
* A rule needs `ids`, `packages` or both. A rule with neither is rejected (see [Errors](#errors)).
* With both, a vulnerability must match both: that CVE in that package.
* `namespaces` and `selector` work exactly as in `ignoreProducts`, including for images shared between workloads: `xeol_vulnerabilities` is per image digest, so a scoped rule drops a vulnerability from the metric only when it applies to every workload running the image. The API rows and counts hide it for the matching workloads.
There is no VEX or `.trivyignore` support. To hide whole severities, use the severity filters of the API, the web page and the dashboard.
## Tuning xeol and trivy
[Section titled “Tuning xeol and trivy”](#tuning-xeol-and-trivy)
syft catalogs each image once, producing an SBOM (a list of the software inside it). Two scanners then read that SBOM:
* xeol looks for end-of-life software.
* trivy looks for known vulnerabilities.
Where you change a setting matters:
* **Config file** settings apply live.
* **Helm** values become operator flags or pod settings. Changing them rolls the pod; a `helm upgrade` does that for you.
### EOL scanning (xeol)
[Section titled “EOL scanning (xeol)”](#eol-scanning-xeol)
| Setting | Where | Default | What it changes |
| ----------------------------------------------------- | -------------------- | -------------------------------- | ------------------------------------------------------------------------- |
| `eol.enabled` | Helm (`--eol`) | `true` | Turns EOL scanning on or off. At least one of xeol and trivy stays on. |
| `ignoreProducts` | config file (live) | none | Hides accepted EOL findings; see [Ignoring products](#ignoring-products). |
| `db.source` | Helm (`--db-source`) | `online` | Where the EOL database comes from. |
| `db.url` | Helm (`--eol-url`) | endoflife.date’s `products/full` | Point online builds at an internal mirror of endoflife.date. |
| `db.mounted.volume`, `db.mounted.initContainer.image` | Helm | none | Where a mounted EOL database comes from. |
| `prometheusRule.eolSoonDays` | Helm | `90` | How close an EOL date must be for `XeolEOLSoftwareSoon`. |
| `prometheusRule.dbStaleDays` | Helm | `30` | Age of the EOL database before `XeolDatabaseStale` fires. |
Details:
* `ignoreProducts` can match by product, cycle, namespace or workload labels.
* `db.source: online` builds the EOL database from endoflife.date at start and daily. `mounted` reads a prebuilt one ([Air-gapped installation](/xeol-operator/air-gapped/)).
* A mounted EOL database comes either from a volume, or is copied out of an image at startup.
Fixed by design:
* xeol always looks 10 years ahead and exports the EOL date itself. So “how soon counts” is a query or alert threshold, not a setting.
* xeol’s auto-update and age check are off, because the operator manages the database.
* xeol never contacts `xeol.io` and never uploads results.
* syft uses xeol’s cataloger selection.
### Vulnerability scanning (trivy)
[Section titled “Vulnerability scanning (trivy)”](#vulnerability-scanning-trivy)
| Setting | Where | Default | What it changes |
| -------------------------------------------- | ------------------------------ | ----------------------------------------- | ------------------------------------------------------------------------------------------ |
| `trivy.enabled` | Helm (`--trivy`) | `false` | Turns vulnerability scanning on. |
| `trivy.dbRepository` | Helm (`--trivy-db-repository`) | trivy’s (`mirror.gcr.io`, then `ghcr.io`) | OCI repositories to download the database from, e.g. an internal mirror. |
| `trivy.dbSizeLimit` | Helm | `5Gi` | Size of the database volume in online mode. |
| `trivy.mounted.volume`, `trivy.mounted.path` | Helm | none, `/trivy-db` | Read trivy’s database from a volume instead of downloading it. |
| `trivy.dbStaleDays` | Helm | `7` | Age of the trivy database before `XeolVulnDatabaseStale` fires. |
| `ignoreVulnerabilities` | config file (live) | none | Hides accepted vulnerabilities; see [Ignoring vulnerabilities](#ignoring-vulnerabilities). |
Details:
* With `trivy.enabled`, the pod downloads trivy’s database (\~1.6 GB) before it turns Ready.
* `trivy.dbSizeLimit` must hold the current copy plus the next download.
* `trivy.mounted.*` applies with `db.source: mounted`.
Fixed by design:
* Only trivy’s vulnerability scanner runs, and only against the SBOM. There’s no `trivy image`, and no secret, misconfiguration or license scanning.
* Only the main database is used, not the Java database.
* Scans never update the database or call out.
* Ignore rules are applied at export, not passed to trivy, so changing them needs no rescan. There is no VEX support.
### Shared by both
[Section titled “Shared by both”](#shared-by-both)
| Setting | Where | Default | What it changes |
| -------------------------------------------------------------------------- | ------------------------------ | --------------------- | ---------------------------------------------------------------------------- |
| `interval` | config file (live) | `24h` | How often each image digest is rescanned by both. |
| `namespaceSelector`, `excludeNamespaces`, `excludeImages`, `workloadKinds` | config file (live) | see [Fields](#fields) | Which running images are scanned at all. |
| `scanner.workers` | Helm (`--scan-workers`) | `1` | Images scanned at the same time. Memory use adds up per worker. |
| `scanner.timeout` | Helm | `10m` | Limit for one image’s whole scan: syft, xeol and trivy. |
| `scanner.checkInterval` | Helm (`--scan-check-interval`) | `1m` | How often images due for a rescan are queued. New images are queued at once. |
| `scanner.goMemLimit`, `scanner.maxProcs` | Helm | `800MiB`, `2` | `GOMEMLIMIT` and `GOMAXPROCS` for syft, xeol and trivy. |
| `scanTmp.sizeLimit` | Helm | `4Gi` | Scratch space for the image layers syft unpacks. |
| `resources.limits.memory` | Helm | `1Gi` | The pod’s memory. |
Details:
* Keep `scanner.goMemLimit` below `resources.limits.memory`.
* The `scanTmp` scratch space is cleared after each scan.
* An image whose scan needs more than `resources.limits.memory` is skipped for 24h (`reason="oom"`).
* Memory use per scan: syft is the peak (\~250 MB for a slim image). trivy adds \~100 MB and xeol \~70 MB, one after the other.
### Reporting and the pod
[Section titled “Reporting and the pod”](#reporting-and-the-pod)
These settings control how findings reach you and where the pod runs. All are Helm values. The full list with defaults is in [Values](/xeol-operator/helm/#values).
| Setting | Default | What it changes |
| --------------------------------------------------------------------------------- | ------------------------- | ----------------------------------------------------------------------------------------- |
| `workloadLabels` (config file, live) | none | Puts your workload labels (`team`, `app.kubernetes.io/part-of`) on `xeol_image_workload`. |
| `serviceMonitor.enabled`, `.interval`, `.labels` | `false`, `60s`, `{}` | Prometheus scraping. |
| `prometheusRule.enabled`, `.labels`, `.eolSoonDays`, `.dbStaleDays` | `false`, `{}`, `90`, `30` | Alert rules and their thresholds. |
| `grafanaDatasource.enabled`, `.labels`; `grafanaDashboard.labels`, `.annotations` | `false` | The Infinity datasource and dashboards. |
| `ui.enabled` | `false` | Built-in web page at `/`. |
| `mcp.enabled` | `false` | MCP tools at `/mcp` for AI assistants. |
| `mcp.allowRescan` | `false` | Adds the MCP `rescan` tool; see [Rescan now](/xeol-operator/usage/#8-rescan-now). |
| `metrics.port` | `8080` | Port for `/metrics`, the JSON API, the web page and MCP. |
| `replicas` | `1` | Extra replicas are standby (leader election). |
| `image.repository`, `image.tag`, `image.pullPolicy`, `imagePullSecrets` | Docker Hub, chart version | The operator image, e.g. from an internal mirror. |
| `nodeSelector`, `tolerations`, `affinity`, `priorityClassName`, `podAnnotations` | empty | Pod placement and metadata. |
Details:
* `workloadLabels` lets you route alerts and group dashboards by owner.
* `serviceMonitor.labels`: add `{release: }` if your Prometheus selects ServiceMonitors by label.
* `prometheusRule`: to tune severities or `for:` durations, copy the rules into your own `PrometheusRule`.
* `grafanaDatasource` / `grafanaDashboard`: set the labels your Grafana sidecars watch. Set the `grafana_folder` annotation to choose a folder.
* `ui.enabled`: the page’s filters and timeline are described in [Usage](/xeol-operator/usage/).
* `replicas`: only the leader scans and serves.
The JSON API takes query parameters too: `namespace`, `kind`, `within_days` and `severity`. See [Usage](/xeol-operator/usage/).
Private registries need no setting. Each scan uses the `imagePullSecrets` of the Pod (and its ServiceAccount) that runs the image.
## Status
[Section titled “Status”](#status)
You can see scan progress and health in three places: the operator’s JSON API, the metrics and the readiness probe. To query the JSON API:
```bash
kubectl -n xeol-system port-forward svc/xeol-operator-metrics 8080
curl -s localhost:8080/api/v1/status
```
| Field | Meaning |
| ------------------------------------- | ---------------------------------------------------------------------------------------------------- |
| `images_tracked`, `images_scanned` | Running image digests, and those with a scan result. |
| `workloads_eol`, `workloads_eol_soon` | Workloads with software past EOL, or reaching it within `within_days`. Ignored findings don’t count. |
| `last_sweep` | The time of the oldest scan result. Set once every running digest has a result. |
| `db_built`, `db_age_seconds` | The EOL database in use. The `XeolDatabaseStale` alert fires after 30 days. |
| `failed_scans_by_reason` | Images whose last scan failed, grouped by reason. |
| `config_error` | Why the config file was last rejected. Empty when the current file is applied. |
The pod turns Ready once the database of every enabled scan type is usable. The web page shows the same numbers.
## Examples
[Section titled “Examples”](#examples)
### Every field
[Section titled “Every field”](#every-field)
This example uses every field and explains each one. Every value shown is valid; delete what you don’t need. It is the whole schema: any other key is rejected.
```yaml
# Scan only Pods in namespaces whose labels match. Empty or absent = all namespaces.
# Standard Kubernetes label selector: matchLabels and/or matchExpressions (both must match).
namespaceSelector:
matchLabels:
xeol-scan: "true" # kubectl label ns payments xeol-scan=true
matchExpressions:
- {key: environment, operator: In, values: [prod, staging]} # In, NotIn, Exists, DoesNotExist
# Namespaces to skip (globs: * = any characters, ? = one character).
# An exclude always wins over namespaceSelector.
excludeNamespaces:
- "kube-*"
- monitoring
- cert-manager
# Images to skip (globs). Matched against the image as written in the Pod spec
# and against its repository, so "python:3.8-slim" and "docker.io/library/python" both work.
excludeImages:
- "registry.internal/*" # registry.internal/app and registry.internal/team/app
- "docker.io/library/busybox"
# Time from a successful scan of a digest to its next scan. Go duration: 30m, 12h, 168h.
# Absent, zero or negative = 24h.
interval: 12h
# Top-level workload kinds to scan, matched exactly. A Pod's kind is its top owner:
# Pod -> ReplicaSet -> Deployment, Job -> CronJob.
# absent = [Deployment, StatefulSet, DaemonSet, Job, CronJob]
# [] = every kind, including bare Pods and operator-owned Pods
workloadKinds: [Deployment, StatefulSet, DaemonSet, Job, CronJob, Rollout]
# Workload label keys copied onto xeol_image_workload as k8s_label_.
# "." and "/" become "_": app.kubernetes.io/part-of -> k8s_label_app_kubernetes_io_part_of
workloadLabels: [team, app.kubernetes.io/part-of]
# Accepted findings to hide from metrics, the JSON API, the web page and MCP.
# Images are still scanned. Removing a rule brings the findings back with no rescan.
ignoreProducts:
# Everywhere: every perl finding.
- products: [perl] # required, at least one: endoflife.date slugs or display names, case-insensitive
# Only one cycle, only in some namespaces (globs).
- products: [python]
cycles: ["3.8"] # release cycles; absent = every cycle
namespaces: ["test", "dev-*"]
# Only workloads whose own labels match (Deployment, DaemonSet, ...; or a bare Pod).
# With both namespaces and selector, a workload must match both.
- products: [nodejs, "Gorilla Toolkit"]
selector:
matchLabels: {team: legacy}
# Accepted vulnerabilities (trivy.enabled) to hide, the same way. A rule needs ids, packages or both;
# with both, that CVE in that package. namespaces and selector work as in ignoreProducts.
ignoreVulnerabilities:
- ids: [CVE-2024-1234] # vulnerability IDs (CVE-..., GHSA-...), case-insensitive
- packages: [libcrypto3] # package names as trivy reports them
namespaces: [test]
```
The chart renders this same file from Helm values. The keys under `scanner:` in `values.yaml` are these keys, so you can paste this block into your values file unchanged.
`workloadKinds` works the same way in Helm values: leave it out (the chart default is `null`) for the default list, or set `[]` to scan every kind.
### Smaller files
[Section titled “Smaller files”](#smaller-files)
These are files as the chart renders them, from Helm values under `scanner:` with the same keys.
Scan everything, daily (an empty file):
```yaml
{}
```
Opt-in namespaces, a team label on metrics, twice a day:
```yaml
namespaceSelector:
matchLabels: {xeol-scan: "true"} # kubectl label ns payments xeol-scan=true
workloadLabels: [team]
interval: 12h
```
Skip system namespaces and internal images:
```yaml
excludeNamespaces: ["kube-*", "monitoring", "cert-manager"]
excludeImages:
- "registry.internal/*" # registry.internal/app and registry.internal/team/app
- "docker.io/library/busybox"
```
## Default Helm values
[Section titled “Default Helm values”](#default-helm-values)
The chart’s `values.yaml`, loaded from the repository at build time. The `scanner.*` values become the config file above; the rest are described in [Helm setup](/xeol-operator/helm/#values).
```yaml
image:
repository: docker.io/rishang/xeol-operator # Docker Hub
tag: "" # defaults to the chart appVersion
pullPolicy: IfNotPresent
imagePullSecrets: [] # for pulling the operator image itself
# Scan types; at least one must be on. Both read the SBOM of the same single syft run per image.
eol:
enabled: true # end-of-life software, matched by xeol against the EOL database (db.*)
trivy:
# Known vulnerabilities, matched by `trivy sbom` against trivy's database. Adds ~0.2s and ~150MB per scan.
# The database follows db.source: online downloads it at start and daily (~1.6 GB, egress to
# mirror.gcr.io or ghcr.io); mounted reads trivy.mounted.volume (see https://rishang.github.io/xeol-operator/air-gapped/).
enabled: false
dbRepository: [] # OCI repositories for the DB, e.g. [registry.local/aquasec/trivy-db:2]; empty = trivy's defaults
dbSizeLimit: 5Gi # emptyDir for the DB in online mode: the current copy (~1.6 GB) plus one being downloaded, and growth
dbStaleDays: 7 # XeolVulnDatabaseStale threshold (prometheusRule)
mounted:
path: /trivy-db
# Any volume source holding /db/trivy.db and db/metadata.json (trivy's cache layout),
# mounted read-only, e.g. persistentVolumeClaim: {claimName: trivy-db}
volume: {}
# Rendered into the config file (ConfigMap -config, mounted at /etc/xeol-operator/config.yaml).
# Edits apply without a restart: helm upgrade, or kubectl edit the ConfigMap.
scanner:
namespaceSelector: {} # e.g. {matchLabels: {xeol-scan: "true"}}; empty = all namespaces
excludeNamespaces: ["kube-*"]
excludeImages: [] # globs on the image reference
interval: 24h # rescan each image digest this often
workloadKinds: null # top-level kinds to scan; null = [Deployment, StatefulSet, DaemonSet, Job, CronJob], [] = every kind
workloadLabels: [] # workload label keys copied onto metrics as k8s_label_, e.g. [team]
# Accepted findings hidden from metrics, the JSON API and status (images are still scanned). See https://rishang.github.io/xeol-operator/configuration/.
# - products: [perl] # endoflife.date slugs
# namespaces: [test] # optional namespace globs
# - products: [gorilla]
# selector: {matchLabels: {app.kubernetes.io/name: grafana}} # optional, workload's own labels
# - products: [python]
# cycles: ["3.8"] # optional release cycles
ignoreProducts: []
# Accepted vulnerabilities (trivy.enabled) hidden the same way. A rule needs ids, packages or both
# (both: that CVE in that package); namespaces and selector work as above.
# - ids: [CVE-2024-1234]
# - packages: [libcrypto3]
# namespaces: [test]
ignoreVulnerabilities: []
# Operator flags. A scan's memory depends on the image (small images ~200Mi); an image that needs
# more than the pod's memory limit is skipped for 24h and reported as xeol_scan_errors_total{reason="oom"}.
workers: 1
timeout: 10m
checkInterval: 1m # how often images due for a rescan are queued (rescan interval is `interval`)
goMemLimit: 800MiB # GOMEMLIMIT for syft, xeol and trivy: keep below resources.limits.memory
maxProcs: 2 # GOMAXPROCS for syft, xeol and trivy
# EOL database xeol matches against.
db:
# online: the operator builds it from endoflife.date at start and daily (needs egress to endoflife.date).
# mounted: read a prebuilt DB from a volume (air-gapped; see https://rishang.github.io/xeol-operator/air-gapped/).
source: online
# online mode: endoflife.date products/full URL; point at an internal mirror if needed.
url: https://endoflife.date/api/v1/products/full
mounted:
path: /xeol-db
# Any volume source holding /1/xeol.db, mounted read-only, e.g.
# persistentVolumeClaim: {claimName: xeol-db}
volume: {}
# Or copy the DB out of an image at startup. The image needs `sh` and the DB at /db
# (e.g. FROM busybox + COPY db /db). Takes precedence over `volume`.
initContainer:
image: ""
command: ["sh", "-c", "cp -r /db/. /xeol-db/"]
# Scratch space for image layers syft unpacks during a scan; removed after each scan.
scanTmp:
sizeLimit: 4Gi
resources:
requests:
cpu: 100m
memory: 256Mi
limits:
memory: 1Gi
replicas: 1
podAnnotations: {}
nodeSelector: {}
tolerations: []
affinity: {}
priorityClassName: ""
# Port for /metrics, the JSON API (/api/v1/*), and the UI and MCP when enabled. Plain HTTP, no auth.
metrics:
port: 8080
# Built-in web page at /: tiles, an EOL timeline (click a dot to filter), a sortable and filterable findings
# table, workload and namespace summaries. For clusters without Grafana. The browser loads htmx from jsDelivr;
# without it, filters still work by page reload.
# Read-only, no auth: reach it with kubectl port-forward; don't expose it via an Ingress.
ui:
enabled: false
# MCP over HTTP at /mcp (Streamable HTTP, stateless) for AI assistants, e.g.
# claude mcp add --transport http xeol http://localhost:8080/mcp
# Read-only tools status, namespaces, workloads, findings: same data as the JSON API. No auth; cross-origin
# browser requests are refused.
mcp:
enabled: false
# Add a "rescan" tool that queues an immediate rescan of all or matching images. The MCP endpoint
# has no auth, so anyone who reaches the port can queue rescans (at most one extra scan per image
# at a time). Without it, rescan from inside the pod: kubectl exec deploy/ -- /manager rescan
allowRescan: false
# ServiceMonitor: the Prometheus Operator scrapes /metrics, so findings are in Prometheus for PromQL,
# history and alerts. Needs the Prometheus Operator (e.g. kube-prometheus-stack).
serviceMonitor:
enabled: false
interval: 60s
labels: {} # e.g. {release: kube-prom-stack} if your Prometheus selects by label
# PrometheusRule: alert rules only (no recording rules), sent through Alertmanager:
# XeolEOLSoftwareRunning software past EOL is running
# XeolEOLSoftwareSoon software reaches EOL within eolSoonDays
# XeolDatabaseStale EOL database older than dbStaleDays
# XeolDatabaseMissing no EOL database, so nothing is scanned
# XeolScanErrors more than 5 failed scans with one reason in an hour
# XeolVulnDatabaseStale trivy vulnerability database older than trivy.dbStaleDays (trivy.enabled)
# The EOL rules are installed only with eol.enabled.
# Needs the Prometheus Operator, and serviceMonitor.enabled (or your own scrape) for data.
prometheusRule:
enabled: false
labels: {} # e.g. {release: kube-prom-stack} if your Prometheus selects rules by label
eolSoonDays: 90 # XeolEOLSoftwareSoon threshold
dbStaleDays: 30 # XeolDatabaseStale threshold
# Grafana: two ConfigMaps, an Infinity datasource (uid xeol-operator) pointing at the JSON API and the
# dashboards that use it: xeol (EOL, with eol.enabled) and xeol-trivy (vulnerabilities, with trivy.enabled). Grafana's datasource and dashboard sidecars pick them up by label; the chart
# never contacts Grafana. Needs the Infinity plugin (yesoreyeram-infinity-datasource) and sidecars
# watching this namespace (searchNamespace: ALL). Doesn't need Prometheus.
grafanaDatasource:
enabled: false # also installs the dashboard
labels:
grafana_datasource: "1" # match your datasource sidecar's label
# The dashboard ConfigMap, installed with grafanaDatasource.enabled.
grafanaDashboard:
labels:
grafana_dashboard: "1" # match your dashboard sidecar's label
annotations: {} # e.g. {grafana_folder: Security} to pick a folder
```
## Upgrading from the XeolScanner CRD
[Section titled “Upgrading from the XeolScanner CRD”](#upgrading-from-the-xeolscanner-crd)
Older chart versions, from before the config file, configured scanning through a cluster-scoped `XeolScanner` named `default`. The settings are the same, under the same `scanner.*` values. So `helm upgrade` carries them over:
* Helm removes the old `XeolScanner/default` object.
* Helm creates the ConfigMap.
Helm never deletes CRDs, so remove the old one once yourself:
```bash
kubectl delete crd xeolscanners.xeol.io --ignore-not-found
```
Did you manage the CR yourself (e.g. with GitOps)? Then move its `spec` fields into your `scanner:` values. Or put them unchanged into the ConfigMap’s `config.yaml`. The field names are the same.
# Helm setup
> Every Helm chart value: scan types, databases, memory, Prometheus, alerts, Grafana, the web page and MCP.
The Helm chart is the supported way to install the operator. It gives you:
* one operator pod, with syft, xeol and trivy bundled,
* the scan config file, as a ConfigMap,
* optional wiring for Prometheus, alerts and a Grafana dashboard.
The chart is published at `https://rishang.github.io/xeol-operator`, one version per release. It is also listed on [Artifact Hub](https://artifacthub.io/packages/helm/xeol-operator/xeol-operator). Its source is in [`helm/xeol-operator`](https://github.com/Rishang/xeol-operator/tree/main/helm/xeol-operator).
[](https://artifacthub.io/packages/helm/xeol-operator/xeol-operator)
## Requirements
[Section titled “Requirements”](#requirements)
* Helm 3.
* Egress to `endoflife.date` (or see [Air-gapped installation](/xeol-operator/air-gapped/)).
* Egress to the registries your images come from.
* Optional, for the ServiceMonitor and PrometheusRule: the Prometheus Operator (e.g. kube-prometheus-stack).
* Optional, for the dashboard: Grafana with its sidecar, plus the [Infinity](https://grafana.com/grafana/plugins/yesoreyeram-infinity-datasource/) plugin.
## Install
[Section titled “Install”](#install)
Add the chart repository once:
```bash
helm repo add xeol-operator https://rishang.github.io/xeol-operator
helm repo update
```
Minimal install (metrics only):
```bash
helm install xeol-operator xeol-operator/xeol-operator -n xeol-system --create-namespace
```
With kube-prometheus-stack and Grafana:
```bash
# serviceMonitor.enabled Prometheus scrapes the EOL metrics (PromQL, history). Needs the Prometheus Operator.
# prometheusRule.enabled Alert rules: EOL software running or due soon, stale DB, failing scans. Needs the ServiceMonitor.
# grafanaDatasource.enabled Infinity datasource + dashboard, loaded by Grafana's sidecars. Needs the Infinity plugin.
helm install xeol-operator xeol-operator/xeol-operator -n xeol-system --create-namespace \
--set serviceMonitor.enabled=true \
--set prometheusRule.enabled=true \
--set grafanaDatasource.enabled=true
```
The pod turns Ready once the first EOL database build succeeds. Scanning starts then.
To add vulnerability scanning with trivy, run the command below. trivy reads the same SBOM, so there’s no second image pull. The pod also downloads trivy’s \~1.6 GB database before it turns Ready.
```bash
helm upgrade xeol-operator xeol-operator/xeol-operator -n xeol-system --reuse-values --set trivy.enabled=true
```
Check that it works:
```bash
kubectl -n xeol-system logs deploy/xeol-operator | grep -E 'scanned|scan failed'
kubectl -n xeol-system port-forward svc/xeol-operator-metrics 8080 &
curl -s localhost:8080/api/v1/status
curl -s localhost:8080/metrics | grep ^xeol_
```
## What gets installed
[Section titled “What gets installed”](#what-gets-installed)
| Kind | Name | When |
| ----------------------------------------------- | ------------------------------------------------------------------------- | --------------------------- |
| ServiceAccount, ClusterRole, ClusterRoleBinding | `xeol-operator` | always |
| Role, RoleBinding | `xeol-operator-leader-election` | always |
| Service | `xeol-operator-metrics` (port 8080: `/metrics`, `/api/v1/*`) | always |
| Deployment | `xeol-operator` | always |
| ConfigMap | `xeol-operator-config` (the [config file](/xeol-operator/configuration/)) | always, from `scanner.*` |
| ServiceMonitor | `xeol-operator` | `serviceMonitor.enabled` |
| PrometheusRule | `xeol-operator` | `prometheusRule.enabled` |
| ConfigMap | `xeol-operator-datasource` | `grafanaDatasource.enabled` |
| ConfigMap | `xeol-operator-dashboard` | `grafanaDatasource.enabled` |
Notes:
* `xeol-operator-config` is mounted at `/etc/xeol-operator/`.
* `xeol-operator-dashboard` holds `xeol.json` with `eol.enabled`, and `xeol-trivy.json` with `trivy.enabled`.
RBAC is read-only. The operator can read Pods, Namespaces, ServiceAccounts, Nodes, Secrets (only to read image pull secrets) and apps/batch workloads. The chart installs no CRD.
## Features
[Section titled “Features”](#features)
Out of the box, the operator scans and serves `/metrics` and the JSON API (`/api/v1/*`) on port 8080. Everything else is opt-in.
Each feature reads the same in-memory results. None depends on another unless noted.
| Feature | Value | Gives you | Needs |
| ------------------ | ----------------------------------------- | -------------------------------------------------- | -------------------------------------------------------------- |
| Scan types | `eol.enabled` (on), `trivy.enabled` (off) | End-of-life software and/or known vulnerabilities | trivy: egress to its DB registry or a mounted DB, a 5Gi volume |
| Metrics collection | `serviceMonitor.enabled` | EOL findings in Prometheus: PromQL, history | Prometheus Operator |
| Alerts | `prometheusRule.enabled` | Notifications through Alertmanager | Prometheus Operator, and the ServiceMonitor for data |
| Grafana dashboard | `grafanaDatasource.enabled` | Datasource + ready-made dashboard | Grafana sidecars, Infinity plugin |
| Built-in web page | `ui.enabled` | Dashboard without Grafana | A browser and `kubectl port-forward` |
| MCP tools | `mcp.enabled` | Ask an AI assistant about EOL findings | An MCP client and `kubectl port-forward` |
| EOL data source | `db.source` | Online (daily from endoflife.date) or a mounted DB | Egress, or a DB you ship |
### Metrics collection: `serviceMonitor.enabled`
[Section titled “Metrics collection: serviceMonitor.enabled”](#metrics-collection-servicemonitorenabled)
**Use it to** get findings into Prometheus. You can then query them with PromQL, keep history, and build your own panels or alerts.
**Creates** a `ServiceMonitor`. It tells the Prometheus Operator to scrape `xeol-operator-metrics:8080/metrics` every `serviceMonitor.interval` (60s).
**How it works:** on each scrape, the operator answers from memory. So an image that stops running loses its series straight away. The metrics are listed in the [README](https://github.com/Rishang/xeol-operator#metrics).
**Leave it off** if you have no Prometheus Operator. You can still scrape the Service yourself. Or skip Prometheus entirely: the dashboard, web page and MCP don’t need it.
**Check:** in Prometheus → Status → Targets, the target `serviceMonitor/xeol-system/xeol-operator` is `UP`. By default, kube-prometheus-stack only selects ServiceMonitors labelled `release: `. If yours does, set `serviceMonitor.labels.release`.
### Alerts: `prometheusRule.enabled`
[Section titled “Alerts: prometheusRule.enabled”](#alerts-prometheusruleenabled)
**Use it to** get told about EOL software, instead of having to look. It holds only alert rules (no recording rules), so nothing else depends on it.
**Creates** a `PrometheusRule`. Here’s the path an alert takes:
1. The Prometheus Operator loads the rule into Prometheus.
2. Prometheus evaluates it every minute and sends firing alerts to Alertmanager.
3. Alertmanager routes them to Slack, PagerDuty, email and so on.
| Alert | Fires when | Severity |
| ------------------------ | -------------------------------------------------------------------------- | -------- |
| `XeolEOLSoftwareRunning` | Software already past EOL runs, for 10 minutes. | warning |
| `XeolEOLSoftwareSoon` | Software reaches EOL within `prometheusRule.eolSoonDays` (90), for 1 hour. | info |
| `XeolDatabaseStale` | The EOL database is older than `prometheusRule.dbStaleDays` (30). | warning |
| `XeolDatabaseMissing` | No EOL database for 30 minutes, so nothing is scanned. | warning |
| `XeolScanErrors` | More than 5 scans failed with one reason in the last hour, for 15 minutes. | info |
The last three tell you the operator itself is unhealthy. An empty dashboard can’t tell you that: no findings could mean “all good” or “scanning stopped”.
Alerts fire per image and product, not per workload. To route by team, set `scanner.workloadLabels: [team]`. Then write your own rule that joins `xeol_image_workload` on `digest`.
**Leave it off** in these cases:
* You have no Prometheus Operator. The `PrometheusRule` kind won’t exist, and the install fails.
* You write your own rules.
Without the ServiceMonitor, the rules have no data. Only `XeolDatabaseMissing` would fire.
**Check:** Prometheus → Alerts lists the `xeol-operator` group. Some setups select rules by label; if so, set `prometheusRule.labels.release`.
### Grafana dashboard: `grafanaDatasource.enabled`
[Section titled “Grafana dashboard: grafanaDatasource.enabled”](#grafana-dashboard-grafanadatasourceenabled)
**Use it to** get a ready-made Grafana dashboard. It shows:
* headline stats,
* EOL by namespace and workload,
* a per-workload product table (red past EOL, yellow within 6 months),
* the full findings list.
You can filter it by namespace, kind and an upcoming window.

**Creates** two ConfigMaps in the operator’s namespace:
* `xeol-operator-datasource`, labelled `grafana_datasource: "1"`: an [Infinity](https://grafana.com/grafana/plugins/yesoreyeram-infinity-datasource/) datasource (uid `xeol-operator`) pointing at `http://xeol-operator-metrics..svc:8080`.
* `xeol-operator-dashboard`, labelled `grafana_dashboard: "1"`: the dashboard JSON.
**How it works:** the chart never contacts Grafana. Instead:
1. Grafana’s sidecar containers (`grafana-sc-datasources` and `grafana-sc-dashboard`, in the Grafana pod) watch for ConfigMaps with those labels.
2. They write them into Grafana’s provisioning folders and reload Grafana.
3. The dashboard’s panels query the operator’s JSON API from the Grafana server, inside the cluster.
The dashboard doesn’t read Prometheus, so it works without the ServiceMonitor.
**Needs** on the Grafana side:
* The Infinity plugin (kube-prometheus-stack: `grafana.plugins: [yesoreyeram-infinity-datasource]`).
* Sidecars that watch the operator’s namespace. Set `grafana.sidecar.datasources.searchNamespace` and `grafana.sidecar.dashboards.searchNamespace` to `ALL` (or to a list that includes it).
* Matching labels. If your sidecars use other labels, change `grafanaDatasource.labels` / `grafanaDashboard.labels`. `grafanaDashboard.annotations` can set a folder (e.g. `grafana_folder: Security`).
* Network access from Grafana to the operator’s Service on port 8080.
**Leave it off** if you have no Grafana sidecars. Then set things up by hand: add an Infinity datasource with uid `xeol-operator` and the URL above, and import `helm/xeol-operator/dashboards/xeol.json`.
**Check:** `kubectl -n logs deploy/ -c grafana-sc-datasources | grep xeol` shows `Writing .../xeol-operator-datasource.yaml`.
### Built-in web page: `ui.enabled`
[Section titled “Built-in web page: ui.enabled”](#built-in-web-page-uienabled)
**Use it** in clusters without Grafana, or for a quick look without setting up dashboards.

**Serves** a page at `/` on port 8080. It has:
* tiles: workloads past EOL and due soon, days to the next EOL, EOL database age, and failed scans by reason (hover ⓘ for the affected workloads);
* a timeline with one dot per product release, by EOL date; click a dot to filter the findings;
* a findings table with sorting, per-column filters and resizable columns;
* workload and namespace summaries, and namespace, kind, text and window filters.
```bash
kubectl -n xeol-system port-forward deploy/xeol-operator 8080 # then open http://localhost:8080/
```
**How it works:** the operator renders the HTML. To update the page in place, the browser loads htmx 2.0.4 from jsDelivr (pinned and integrity-checked). If the browser has no internet access, filters still work by reloading the page. Nothing is stored; the page is read-only.
**Leave it off** if nobody will use it. It has no authentication. Reach it by port-forward, never through a public Ingress.
### MCP tools: `mcp.enabled`
[Section titled “MCP tools: mcp.enabled”](#mcp-tools-mcpenabled)
**Use it to** ask an AI assistant questions like “which prod workloads run EOL software?”. This works with Claude Code, Claude Desktop, or any MCP client. (MCP, the Model Context Protocol, lets AI assistants call tools.)
**Serves** an MCP endpoint at `/mcp` (Streamable HTTP, stateless). It has four read-only tools: `status`, `namespaces`, `workloads` and `findings`. Each takes optional `namespace`, `kind` and `within_days` parameters. Each returns the same JSON as the matching `/api/v1/*` endpoint.
```bash
kubectl -n xeol-system port-forward deploy/xeol-operator 8080
claude mcp add --transport http xeol http://localhost:8080/mcp
```
**Leave it off** if you don’t use MCP clients. Like the web page, it has no authentication. Cross-origin browser requests are refused, so a web page can’t call it.
**`mcp.allowRescan`** (default `false`) adds a fifth tool, `rescan`, that queues an immediate rescan of all or matching images. It’s the only tool that changes anything, so it’s opt-in: anyone who reaches the port could queue rescans. Without it, rescan from inside the pod; see [Rescan now](/xeol-operator/usage/#8-rescan-now).
### Scan types: `eol.enabled`, `trivy.enabled`
[Section titled “Scan types: eol.enabled, trivy.enabled”](#scan-types-eolenabled-trivyenabled)
syft pulls and catalogs each image once. The resulting SBOM (a list of the software in the image) then goes to each enabled scanner. At least one scanner must be on; otherwise the chart refuses to render.
* **`eol.enabled` (default `true`):** xeol matches the SBOM against the EOL database (`db.*`). When off, no EOL database is built or required. The EOL metrics, alerts, dashboard and web page tab are left out.
* **`trivy.enabled` (default `false`):** `trivy sbom` matches the same SBOM against trivy’s vulnerability database. It adds about 0.2 s and 150 MB per scan; peak memory is still syft’s. With trivy on you also get:
* the metrics `xeol_vulnerabilities{digest,severity,fixable}` (counts, never one series per CVE) and `xeol_vuln_db_updated_timestamp_seconds`;
* the `/api/v1/vulnerabilities` endpoint;
* the `XeolVulnDatabaseStale` alert;
* the trivy Grafana dashboard and the web page’s Trivy tab.
* **When a trivy step fails:** the image keeps its EOL findings and its previous vulnerabilities. The failure counts as `xeol_scan_errors_total{reason="trivy"}` and is retried after 1h.
* **trivy database:** follows `db.source`.
* Online: downloaded at start and daily from `mirror.gcr.io/aquasec/trivy-db:2` (fallback `ghcr.io/aquasecurity/trivy-db:2`, or `trivy.dbRepository`). It’s stored in an emptyDir of size `trivy.dbSizeLimit`.
* Mounted: read from `trivy.mounted.volume`.
* Either way, scans themselves never download anything or call out. Only the main database is used, not trivy’s Java database.
* **trivy only knows what syft records:** OS and language packages. Software copied into an image outside a package manager (e.g. a Python built from source) has no vulnerability rows. The EOL scan still reports its version.
### EOL data: `db.source`
[Section titled “EOL data: db.source”](#eol-data-dbsource)
**`online` (default):** the operator builds xeol’s database from [endoflife.date](https://endoflife.date) at start and every day.
* The pod is Ready after the first build.
* A failed rebuild keeps the previous database and retries the next day.
* Needs egress to `db.url` (or an internal mirror of it).
**`mounted`:** for air-gapped clusters. Build the database elsewhere and mount it read-only. It can come from a volume, or be copied out of an image by an init container. See [Air-gapped installation](/xeol-operator/air-gapped/).
Either way, three things tell you when the data is old: `xeol_db_built_timestamp_seconds`, `db_age_seconds` in `/api/v1/status`, and the `XeolDatabaseStale` alert.
### Always on: JSON API and private registries
[Section titled “Always on: JSON API and private registries”](#always-on-json-api-and-private-registries)
* **JSON API:** `GET /api/v1/{status,namespaces,workloads,findings}` on port 8080. It’s meant for scripts and the Grafana dashboard. It’s read-only, with no authentication.
* Filters: `namespace`, `kind` (comma-separated) and `within_days` (default 180).
* With `trivy.enabled`, you also get `/api/v1/vulnerabilities` (filter `severity`), and vulnerability counts in status, workloads and namespaces.
* **Private registries:** no setup needed. Each scan uses the `imagePullSecrets` of a Pod running the image, and of its ServiceAccount. They’re written to a temporary file and deleted after the scan. For details and limits (pulls with a cloud identity, expiring tokens), see [Private registries](/xeol-operator/usage/#7-private-registries).
* **High availability:** `replicas > 1` runs standby pods via leader election. Only the leader scans and serves data. The others answer 503, and the web page shows “on standby”.
## Values
[Section titled “Values”](#values)
### Scan scope → the config file
[Section titled “Scan scope → the config file”](#scan-scope--the-config-file)
| Value | Default | Field in `config.yaml` |
| ------------------------------- | ---------------------------------------------------------------------------- | ---------------------------------------------------------------------- |
| `scanner.namespaceSelector` | `{}` (all) | `namespaceSelector` |
| `scanner.excludeNamespaces` | `["kube-*"]` | `excludeNamespaces` |
| `scanner.excludeImages` | `[]` | `excludeImages` |
| `scanner.interval` | `24h` | `interval` |
| `scanner.workloadKinds` | `null` (Deployment, StatefulSet, DaemonSet, Job, CronJob); `[]` = every kind | `workloadKinds` |
| `scanner.workloadLabels` | `[]` | `workloadLabels` |
| `scanner.ignoreProducts` | `[]` | `ignoreProducts` (accepted findings to hide) |
| `scanner.ignoreVulnerabilities` | `[]` | `ignoreVulnerabilities` (accepted vulnerabilities to hide, with trivy) |
The chart renders these into the ConfigMap `xeol-operator-config`. The operator reloads it without a restart. For field behaviour, globs, live reload and errors, see [Configuration](/xeol-operator/configuration/).
You can also edit the ConfigMap directly. A later `helm upgrade` overwrites it from values.
### Scan types
[Section titled “Scan types”](#scan-types)
| Value | Default | Notes |
| ------------------------------- | ------------------ | ----------------------------------------------------------------------------------------------------------- |
| `eol.enabled` | `true` | EOL scanning with xeol. |
| `trivy.enabled` | `false` | Vulnerability scanning with trivy on the same SBOM. |
| `trivy.dbRepository` | `[]` | OCI repositories for the trivy DB, e.g. `[registry.local/aquasec/trivy-db:2]`. Empty uses trivy’s defaults. |
| `trivy.dbSizeLimit` | `5Gi` | emptyDir for the DB (online). |
| `trivy.dbStaleDays` | `7` | Threshold for `XeolVulnDatabaseStale`. |
| `trivy.mounted.path` / `volume` | `/trivy-db` / `{}` | With `db.source=mounted`: a read-only volume with the trivy DB. |
Details:
* `trivy.dbSizeLimit` must fit the current copy (\~1.6 GB), plus one being downloaded, plus growth.
* The `trivy.mounted` volume must hold `/db/trivy.db` and `db/metadata.json`. It’s mounted read-only.
### Scan resources → operator flags
[Section titled “Scan resources → operator flags”](#scan-resources--operator-flags)
| Value | Default | Notes |
| ----------------------- | -------------------------------- | ----------------------------------------------------------------------------------------------------------------------------------- |
| `scanner.workers` | `1` | Concurrent scans. Each needs its own memory headroom. |
| `scanner.timeout` | `10m` | Per image. |
| `scanner.checkInterval` | `1m` | How often images due for a rescan are queued. New images are queued at once; how often an image is rescanned is `scanner.interval`. |
| `scanner.goMemLimit` | `800MiB` | `GOMEMLIMIT` for syft, xeol and trivy. Keep it below `resources.limits.memory`. |
| `scanner.maxProcs` | `2` | `GOMAXPROCS` for syft, xeol and trivy. |
| `resources` | requests 100m / 256Mi, limit 1Gi | Pod CPU and memory. |
| `scanTmp.sizeLimit` | `4Gi` | `/tmp` emptyDir for image layers during a scan. |
What happens when an image’s scan needs more memory than the limit:
1. It OOM-kills the container once (out of memory).
2. The image is then skipped for 24h.
3. It’s reported as `xeol_scan_errors_total{reason="oom"}`.
Small images scan in about 200 MB. Large ones (e.g. grafana) peak around 0.7 GB. If you see `reason="oom"`, raise `resources.limits.memory` and `scanner.goMemLimit` together.
### EOL database
[Section titled “EOL database”](#eol-database)
| Value | Default | Notes |
| -------------------------------- | ------------------------------ | -------------------------------------------------------------------------------------- |
| `db.source` | `online` | `online`: built from endoflife.date at start and daily. `mounted`: read a prebuilt DB. |
| `db.url` | endoflife.date `products/full` | Point at an internal mirror if needed. |
| `db.mounted.path` | `/xeol-db` | |
| `db.mounted.volume` | `{}` | Any volume source holding `/1/xeol.db`, mounted read-only. |
| `db.mounted.initContainer.image` | `""` | Copy the DB out of an image at startup. Wins over `volume`. |
Recipes: [Air-gapped installation](/xeol-operator/air-gapped/).
### Prometheus and Grafana
[Section titled “Prometheus and Grafana”](#prometheus-and-grafana)
| Value | Default | Notes |
| ------------------------------------------------ | ------------------------------- | ---------------------------------------------------------------------------------------------------- |
| `metrics.port` | `8080` | Plain HTTP. Serves `/metrics`, the JSON API, and the UI and MCP when enabled. |
| `ui.enabled` | `false` | Server-rendered HTML UI at `/` (findings, workloads, namespaces). |
| `mcp.enabled` | `false` | MCP over HTTP at `/mcp`, with read-only tools. |
| `mcp.allowRescan` | `false` | Adds the MCP `rescan` tool. No auth: anyone who reaches the port can queue rescans. |
| `serviceMonitor.enabled` / `interval` / `labels` | `false` / `60s` / `{}` | Add e.g. `{release: kube-prom-stack}` if your Prometheus selects by label. |
| `prometheusRule.enabled` / `labels` | `false` / `{}` | Alert rules only; see [Alerts](#alerts-prometheusruleenabled). |
| `prometheusRule.eolSoonDays` | `90` | Threshold for `XeolEOLSoftwareSoon`. |
| `prometheusRule.dbStaleDays` | `30` | Threshold for `XeolDatabaseStale`. |
| `grafanaDatasource.enabled` | `false` | Infinity datasource (uid `xeol-operator`) pointing at the JSON API, plus the dashboards that use it. |
| `grafanaDashboard.labels` / `annotations` | `grafana_dashboard: "1"` / `{}` | Labels and annotations on the dashboard ConfigMap. |
Details:
* `ui.enabled`: the browser loads htmx 2.0.4 from jsDelivr (pinned, SRI, i.e. integrity-checked). Without it, filters still work by reload.
* `mcp.enabled`: Streamable HTTP, stateless. The tools are `status`, `namespaces`, `workloads` and `findings`.
* `grafanaDatasource.enabled`: the dashboards are EOL (`eol.enabled`) and vulnerabilities (`trivy.enabled`), linked to each other.
* `grafanaDashboard.*`: the dashboard ConfigMap is installed with the datasource and picked up by Grafana’s dashboard sidecar. Use `annotations` to set a folder.
What each of these does and needs: [Features](#features).
### Pod
[Section titled “Pod”](#pod)
These values control the operator pod itself:
* `image.repository`, `image.tag` (defaults to the chart `appVersion`), `image.pullPolicy`
* `imagePullSecrets` (for the operator image itself)
* `replicas` (extra replicas are standby via leader election)
* `podAnnotations`, `nodeSelector`, `tolerations`, `affinity`, `priorityClassName`
## Example values file
[Section titled “Example values file”](#example-values-file)
```yaml
scanner:
namespaceSelector:
matchLabels: {xeol-scan: "true"}
excludeNamespaces: ["kube-*", "monitoring"]
workloadLabels: [team]
interval: 24h
ignoreProducts:
- products: [perl]
namespaces: [test]
goMemLimit: 1600MiB # below the 2Gi limit
resources:
limits: {memory: 2Gi}
requests: {cpu: 100m, memory: 256Mi}
serviceMonitor:
enabled: true
labels: {release: kube-prom-stack}
prometheusRule:
enabled: true
labels: {release: kube-prom-stack}
grafanaDatasource:
enabled: true # datasource + dashboard
```
Install or upgrade with it:
```bash
helm upgrade --install xeol-operator xeol-operator/xeol-operator -n xeol-system --create-namespace -f my-values.yaml
```
## Upgrade
[Section titled “Upgrade”](#upgrade)
```bash
helm repo update
helm upgrade xeol-operator xeol-operator/xeol-operator -n xeol-system --reuse-values
```
A new pod starts with an empty state volume and rescans everything.
Upgrading from a chart version that still had the `XeolScanner` CRD? See [Upgrading from the XeolScanner CRD](/xeol-operator/configuration/#upgrading-from-the-xeolscanner-crd).
## Uninstall
[Section titled “Uninstall”](#uninstall)
```bash
helm uninstall xeol-operator -n xeol-system
```
# Air-gapped installation
> Run xeol-operator without internet access: mount the EOL and trivy databases from a volume.
An air-gapped cluster has no internet access. You can still run the operator there. You build the EOL database on a connected machine and hand it to the operator.
How it works:
* In online mode, the operator builds its EOL database from [endoflife.date](https://endoflife.date) at startup and daily. That needs egress (outbound internet access).
* Without egress, build the database on a connected machine instead.
* Then give it to the operator with `db.source=mounted`.
* The operator then never touches the network, except to pull the images it scans from your internal registry.
## 1. Build the database (connected machine)
[Section titled “1. Build the database (connected machine)”](#1-build-the-database-connected-machine)
The operator image can build the database for you:
```bash
docker run --rm -v "$PWD/db:/out" --entrypoint /manager rishang/xeol-operator: build-db --out /out
# -> db/1/xeol.db, db/1/metadata.json
```
You can also build it from a saved endoflife.date dump, for example one fetched through a proxy:
```bash
curl -sSfL https://endoflife.date/api/v1/products/full -o products-full.json
docker run --rm -v "$PWD:/work" --entrypoint /manager rishang/xeol-operator: \
build-db --from /work/products-full.json --out /work/db
```
To check the result, use any xeol v0.10.8 binary. `XEOL_DB_CACHE_DIR=./db xeol db status` should print `Status: valid`.
Rebuild and redistribute the database regularly. Three signals tell you when it’s due:
* the `xeol_db_built_timestamp_seconds` metric
* `db_age_seconds` in `/api/v1/status`
* the `XeolDatabaseStale` alert (30 days by default)
## 2. Get it into the cluster
[Section titled “2. Get it into the cluster”](#2-get-it-into-the-cluster)
Pick one of the three options below.
### a. Database image (recommended)
[Section titled “a. Database image (recommended)”](#a-database-image-recommended)
Air-gapped clusters already mirror images. So ship the database as an image too:
```dockerfile
FROM busybox:1.37
COPY db /db
```
```bash
docker build -t registry.internal/xeol-db:$(date +%F) .
docker push registry.internal/xeol-db:$(date +%F)
```
```yaml
# values.yaml
db:
source: mounted
mounted:
initContainer:
image: registry.internal/xeol-db:2026-10-26
```
At startup, an init container copies `/db` into an `emptyDir` (a scratch volume that lives as long as the pod).
* The image needs `sh` and `cp`.
* For a different layout, override `db.mounted.initContainer.command`.
* To update, push a new tag, then run `helm upgrade --set db.mounted.initContainer.image=...`.
### b. Volume (PVC, NFS, hostPath)
[Section titled “b. Volume (PVC, NFS, hostPath)”](#b-volume-pvc-nfs-hostpath)
Copy `db/` onto any volume and mount it read-only:
```yaml
db:
source: mounted
mounted:
path: /xeol-db
volume:
persistentVolumeClaim:
claimName: xeol-db
```
The volume must contain `1/xeol.db` and `1/metadata.json` at its root:
* /xeol-db (the mounted volume)
* 1/
* xeol.db
* metadata.json
To update, replace the files. The next scan uses them. If you want every image rescanned right away, restart the operator.
### c. Internal endoflife.date mirror (online mode, no egress to the internet)
[Section titled “c. Internal endoflife.date mirror (online mode, no egress to the internet)”](#c-internal-endoflifedate-mirror-online-mode-no-egress-to-the-internet)
Use this if you can host one file internally. You keep online mode and point the operator at your copy:
```bash
curl -sSfL https://endoflife.date/api/v1/products/full -o products-full.json
# upload to e.g. https://files.internal/eol/products-full.json and refresh it daily
```
```yaml
db:
source: online
url: https://files.internal/eol/products-full.json
```
## Vulnerability database (`trivy.enabled`)
[Section titled “Vulnerability database (trivy.enabled)”](#vulnerability-database-trivyenabled)
With `trivy.enabled` and `db.source: mounted`, the operator also reads trivy’s database from a volume. It does not download it.
First, download the database on a connected machine with [trivy](https://trivy.dev). Use a trivy with the same major DB schema as the bundled trivy (`trivy-db:2`):
```bash
trivy image --download-db-only --cache-dir trivy-db
# -> trivy-db/db/trivy.db, trivy-db/db/metadata.json (main DB only; the Java DB isn't needed)
```
Then copy `trivy-db/` onto a volume and mount it read-only:
```yaml
db:
source: mounted
trivy:
enabled: true
mounted:
path: /trivy-db
volume:
persistentVolumeClaim:
claimName: trivy-db
```
The volume must contain `db/trivy.db` and `db/metadata.json` at its root:
* /trivy-db (the mounted volume)
* db/
* trivy.db
* metadata.json
Refresh it at least weekly. `XeolVulnDatabaseStale` fires after `trivy.dbStaleDays` (7).
**Alternative: an internal OCI registry.** If your cluster can reach one, you can keep `db.source: online`:
1. Mirror `mirror.gcr.io/aquasec/trivy-db:2` to your registry (e.g. with `oras cp`).
2. Set `trivy.dbRepository: [registry.internal/aquasec/trivy-db:2]`.
Online mode then needs no internet egress for trivy.
## Registry access
[Section titled “Registry access”](#registry-access)
Nothing extra is needed for pulling images. Scans pull images by digest (the exact image hash) from the registries your Pods use. They use the Pods’ `imagePullSecrets`, and those of their ServiceAccounts. In an air-gapped cluster those are your internal registries.
Images loaded straight onto nodes (`k3d image import`, `kind load`) have no registry digest. They are skipped.
## What never leaves the cluster
[Section titled “What never leaves the cluster”](#what-never-leaves-the-cluster)
The operator never contacts `data.xeol.io` or `xeol.io`:
* xeol runs with auto-update and the update check off.
* xeol never runs with `--api-key`.
trivy scans run with `--skip-db-update --skip-java-db-update --offline-scan --skip-version-check --disable-telemetry`. Only the daily DB download (online mode) reaches the trivy DB registry.
# xeol-operator
> Is end-of-life software still running in your cluster? xeol-operator scans every running image. It finds runtimes, databases, frameworks and distros past end of life, and optionally known CVEs. Then it shows you which workloads to fix first.
[](https://artifacthub.io/packages/helm/xeol-operator/xeol-operator)
```bash
helm repo add xeol-operator https://rishang.github.io/xeol-operator
helm install xeol-operator xeol-operator/xeol-operator -n xeol-system --create-namespace
```
Every running workload
You see what your Pods really run, by image digest, not what a manifest claims. Private registries work with the Pods’ own pull secrets.
Dates, not labels
Every finding has its EOL date and the days left. So “due within 90 days” is just a query. The EOL data is rebuilt daily from endoflife.date.
Known vulnerabilities too
Turn on `trivy.enabled` to check for CVEs too. Trivy reuses the SBOM (software bill of materials) from the EOL scan. There’s no second image pull, and it takes about 0.2 s and 150 MB per image. Hide CVEs you’ve accepted by ID or package.
Fits your stack
The chart ships Prometheus metrics, alert rules and Grafana dashboards. No Grafana? Use the built-in web page or the MCP tools.
## Grafana
[Section titled “Grafana”](#grafana)

## Built-in web page
[Section titled “Built-in web page”](#built-in-web-page)


# Architecture
> How xeol-operator finds running images, scans them with syft, xeol and trivy, and serves the results.
This page explains how xeol-operator works inside. It finds the images your cluster runs, scans them, and serves the results.
* To install and use the operator, see [Usage](/xeol-operator/usage/).
* For chart values, see [Helm setup](/xeol-operator/helm/).
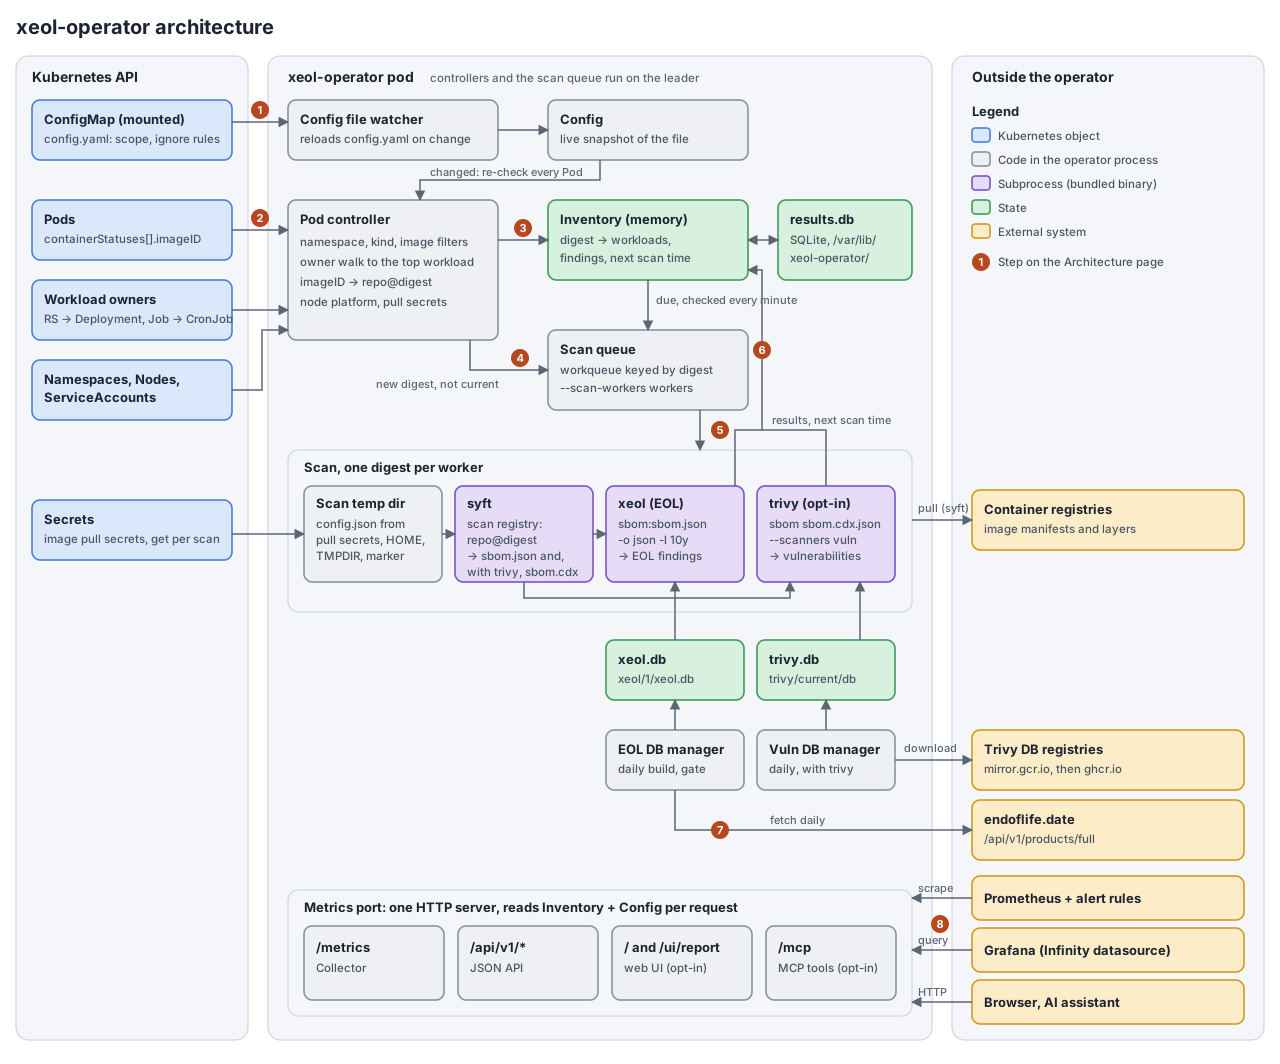⤢ Expand
The numbers in the diagram match the steps under [How it works](#how-it-works).
## Components
[Section titled “Components”](#components)
Everything runs in one pod. The operator creates no scan Jobs and no Secrets. It uses no external database.
| Component | Code | Job |
| ------------------------ | -------------------------------------------------- | ---------------------------------------------------- |
| Config file | `internal/config`, `internal/controller/config.go` | Loads the config file; reloads it on change |
| Pod controller | `internal/controller/pod_controller.go` | Turns running Pods into image digests |
| Inventory | `internal/controller/inventory.go` | In-memory map, keyed by digest |
| Results store | `internal/results` | SQLite copy of each digest’s last scan |
| Scan queue | `internal/scanner/queue.go` | Work queue keyed by digest |
| Scanner | `internal/scanner/xeol.go`, `trivy.go` | Runs syft, then xeol and/or trivy |
| EOL DB manager | `internal/eoldb` | Builds or reads xeol’s database |
| Vulnerability DB manager | `internal/vulndb` | Downloads or reads trivy’s database (with `--trivy`) |
| Collector | `internal/metrics/collector.go` | Renders Prometheus metrics on each scrape |
| HTTP API, UI, MCP | `internal/api` | JSON API, web page and MCP tools |
More detail on each component:
* **Config file:** loads the mounted config file into a live `Config` at startup. It reloads it when the file changes.
* **Pod controller:** each image digest is attributed to its top-level workload. A digest is the `sha256:...` hash that identifies one exact image build.
* **Inventory:** maps each digest to its workloads, pull secrets, findings, vulnerabilities and next scan time.
* **Results store:** keeps the last scans so a container restart doesn’t rescan everything.
* **Scan queue:** runs `--scan-workers` workers, plus a ticker that queues due rescans.
* **Scanner:** runs syft once, then xeol (EOL) and/or trivy (vulnerabilities) as subprocesses. It parses their output into flat rows.
* **EOL DB manager:** builds xeol’s database from endoflife.date at startup and daily, or reads a mounted one.
* **Vulnerability DB manager:** with `--trivy`, downloads trivy’s database at startup and daily, or reads a mounted one.
* **Collector:** builds the metrics from the Inventory.
* **HTTP API, UI, MCP:** served on the metrics port, read from the Inventory.
## How it works
[Section titled “How it works”](#how-it-works)
### 1. Configuration
[Section titled “1. Configuration”](#1-configuration)
You set `scanner.*` values in the chart. The operator reads them from a file at startup and whenever the file changes.
* The chart writes the values into the ConfigMap `xeol-operator-config`.
* The ConfigMap is mounted at `/etc/xeol-operator/config.yaml`.
* At startup the operator parses the file strictly into a `Config` snapshot. It covers the namespace selector, globs, interval, workload kinds and labels, and ignore rules.
* Every other component reads that snapshot.
* If the file is bad at startup, the operator stops and shows the error.
Changes apply without a restart:
* The operator re-reads the file every 5 seconds.
* The kubelet updates the mounted file, because the ConfigMap is mounted without `subPath`.
* When the content has changed, the new config is applied and every Pod is re-evaluated.
* A bad edit keeps the previous config. The error is logged and shows as `config_error` in `/api/v1/status`.
The operator writes nothing to the cluster. Its status (images scanned, findings, last sweep, DB age, failed scans) comes from three places:
* `/api/v1/status`
* the metrics
* the readiness probe
### 2. Discovery
[Section titled “2. Discovery”](#2-discovery)
The operator watches Pods only. For each Pod the controller does five things:
1. **Filters the Pod.** It drops the Pod if any of these are true:
* it has finished (`Succeeded`/`Failed`)
* it is terminating
* it is in an excluded namespace
* it is outside the namespace selector
2. **Finds the top-level workload.** It walks the controller `ownerReferences` upward. Examples: Pod → ReplicaSet → Deployment, Pod → Job → CronJob, or any other kind such as an Argo Rollout. Owners are read as metadata only.
3. **Checks the workload kind.** It keeps the Pod only if the workload’s kind is in `workloadKinds`. The default is Deployment, StatefulSet, DaemonSet, Job, CronJob. `[]` means every kind.
4. **Reads the image digest.** It reads each container’s `imageID` from the Pod status. It splits it into repository and digest. Two cases are skipped:
* A bare `sha256:...`. This is an image loaded straight onto the node, so there is no registry to pull from.
* Anything matching `excludeImages`.
5. **Collects pull details.** It gathers the `imagePullSecrets` of the Pod and of its ServiceAccount. It also records the node’s `os/arch`, so multi-arch images are scanned for the variant that actually runs.
### 3. Inventory
[Section titled “3. Inventory”](#3-inventory)
Each image becomes one entry, keyed by digest. Ten Pods running the same digest are one entry with ten owners. That means one scan, not ten.
When a digest is new to the Inventory, the operator looks up its saved result in SQLite:
* If that result is still current (its next scan time is in the future), it is restored. No scan is queued.
* Otherwise the digest is queued (step 4).
When the last Pod running a digest goes away:
* The digest leaves the Inventory.
* Its metric series disappear on the next scrape.
* Its saved result stays in SQLite for a week past its next scan time. So an image that comes back, such as a CronJob’s next run, is restored instead of rescanned.
### 4. Scheduling
[Section titled “4. Scheduling”](#4-scheduling)
The scan queue decides which digests get scanned and when. It is a client-go workqueue keyed by digest. This gives two guarantees:
* A digest already in the queue is not added twice.
* Two workers never scan the same digest at once.
How digests get queued and run:
* The Pod controller adds new digests straight away.
* A ticker adds digests whose next scan time has passed. It runs every `scanner.checkInterval` (default 1m).
* `manager rescan` (or the opt-in MCP `rescan` tool) adds the matching digests straight away. The CLI reaches the operator through a loopback-only listener (`--admin-bind-address`, default `127.0.0.1:8082`), so only processes in the pod can use it.
* `eol.enabled` (default on) and `trivy.enabled` (default off) choose the scan types. At least one must be on.
* Scanning starts only once the database of every enabled scan type is ready.
* `--scan-workers` (default `1`) sets how many scans run at once. Each scan needs its own memory.
### 5. Scan
[Section titled “5. Scan”](#5-scan)
A worker scans one digest in six steps:
1. **Prepares credentials.** It creates a fresh temp dir under `/tmp`. It builds a `config.json` there from the pull secrets. The secrets are read from the API server at that moment and never cached. The same dir serves as `HOME`, `TMPDIR` and `DOCKER_CONFIG` for both subprocesses.
2. **Writes an in-flight marker** for the digest (see [Failure handling](#failure-handling)).
3. **Runs syft once.** syft builds the SBOM (software bill of materials), a list of every package in the image.
* Command: `syft scan registry:@ --platform `. It pulls the image from its registry.
* Output for xeol: `-o syft-json=sbom.json`.
* Output for trivy, when trivy is on: `-o cyclonedx-json=sbom.cdx.json`. trivy can’t read syft-json.
* The cataloger selection matches what xeol itself would use.
4. **Runs xeol (when EOL is on).**
* Command: `xeol sbom:sbom.json -o json -q -l 10y`, against the local EOL database.
* Auto-update and the age check are turned off.
* `--api-key` is never passed, so nothing is uploaded.
* xeol’s JSON becomes flat findings: product, cycle, EOL date, package, version, type, purl, distro, endoflife.date URL.
* Repeats of the same package found at several paths are dropped.
5. **Runs trivy (when trivy is on).**
* First it adds trivy’s source-package properties (`aquasecurity:trivy:SrcName`, …) to the OS packages in `sbom.cdx.json`. They come from each purl’s `upstream` qualifier. Without them, trivy misses subpackages such as libcrypto3 from openssl.
* Then it runs `trivy sbom --scanners vuln -f json` against the local trivy database. Every update and outbound call is turned off.
* trivy’s JSON becomes flat vulnerability rows: CVE, title, severity, package, installed and fixed version, type, reference URL.
* There is one row per (CVE, package, version).
6. **Cleans up.** It deletes the temp dir (credentials, layers, both SBOMs) and the marker. At startup, the operator also deletes temp dirs left behind by a scan that a container restart interrupted.
Resource limits keep scans inside the pod’s limits:
* syft, xeol and trivy get `GOMEMLIMIT` (`scanner.goMemLimit`) and `GOMAXPROCS` (`scanner.maxProcs`).
* `scanner.timeout` bounds the whole scan.
### 6. Results
[Section titled “6. Results”](#6-results)
Each result goes into the Inventory and into SQLite, with a next scan time:
* **Success:** `now + interval` from the config file (default `24h`).
* **Failure:** `now + 1h`. The previous findings are kept, and the error reason is recorded.
Each digest is rescanned on its own schedule, not all at once.
A database rebuild does not trigger rescans. The EOL date is stored with the result, and “already EOL” is worked out at query time. So only new endoflife.date data has to wait for the next rescan.
### 7. EOL database
[Section titled “7. EOL database”](#7-eol-database)
The operator needs an EOL database before it can scan. It gets one in one of two modes.
**`online` mode (the default):**
* The EOL DB manager downloads `https://endoflife.date/api/v1/products/full` at startup and every 24 hours.
* It builds xeol’s SQLite database from that file.
* Each build is written to a temp dir and swapped in only when complete.
* A failed build keeps the previous database. It is retried the next day, or every 30 seconds while there is no usable database.
* The operator never contacts `data.xeol.io`.
**`mounted` mode:** the operator reads a prebuilt database from a volume instead. This is for air-gapped clusters; see [Air-gapped installation](/xeol-operator/air-gapped/).
Readiness and staleness:
* The pod is Ready once a valid database has existed at least once. This is checked with `xeol db status`.
* The build time is exported as `xeol_db_built_timestamp_seconds`.
* The `XeolDatabaseStale` alert fires after 30 days.
### 8. Export
[Section titled “8. Export”](#8-export)
One HTTP server on the metrics port serves everything. It reads the Inventory and Config on each request. Nothing is pushed anywhere.
| Path | What | Enabled by |
| ---------------------------------------------------------- | --------------------------------------------------------------------------------------- | --------------------------------------- |
| `/metrics` | Prometheus metrics (see the [README](https://github.com/Rishang/xeol-operator#metrics)) | always |
| `/api/v1/status`, `/namespaces`, `/workloads`, `/findings` | Read-only JSON for Grafana’s Infinity datasource | always (`/findings` with `eol.enabled`) |
| `/api/v1/vulnerabilities` | One row per workload, CVE and package | `trivy.enabled` |
| `/`, `/ui/report` | Server-rendered web page | `ui.enabled` |
| `/mcp` | `status`, `namespaces`, `workloads` and `findings` as MCP tools (Streamable HTTP) | `mcp.enabled` |
`ignoreProducts` and `ignoreVulnerabilities` rules are applied here, at export time. So changing them takes effect without a rescan.
The metrics come from a custom collector. It builds every series from the Inventory on each scrape. When an image stops running, there is nothing to delete: its series simply stop appearing.
Series count stays small:
* Findings are one series per (digest, product, cycle, package, version).
* Workloads are one series per (digest, workload).
* The two are joined on `digest`.
* So cardinality (the number of series) does not grow with Pod count.
## Where data is stored
[Section titled “Where data is stored”](#where-data-is-stored)
All writable data lives on emptyDir volumes. An emptyDir is scratch space that survives a container restart but is wiped when the pod is replaced.
| What | Path in the container | Volume | Survives |
| -------------------------------------------------------- | ----------------------------------------------------------- | ---------------------- | ----------------------------------------- |
| EOL database (converted for xeol) | `/var/cache/xeol/1/xeol.db` | `xeol-db` emptyDir | container restart; rebuilt on a new pod |
| EOL database metadata (build time, checksum) | `/var/cache/xeol/1/metadata.json` | `xeol-db` emptyDir | same |
| EOL database in `mounted` mode | `/1/xeol.db`, default `/xeol-db/1/xeol.db` | your volume, read-only | as long as the volume |
| Scan results cache (SQLite) | `/var/lib/xeol-operator/results.db` | `state` emptyDir | container restart; a new pod starts empty |
| In-flight scan markers | `/var/lib/xeol-operator/inflight/` | `state` emptyDir | container restart (that is the point) |
| Per-scan temp dir (pull credentials, SBOM, image layers) | `/tmp/scan-*` | `tmp` emptyDir | deleted when the scan ends |
The paths come from `--db-dir` and `--state-dir`, which the chart sets.
During an EOL database rebuild:
* The new database is written to `/var/cache/xeol/.build-*`, then moved into place.
* The previous copy is briefly kept as `/var/cache/xeol/1.old`.
With trivy on, the trivy database is handled the same way:
* It is downloaded to `/var/cache/trivy/current/db/trivy.db`. This is the main DB only, \~1.6 GB.
* The download goes into `/var/cache/trivy/.download-*` first, then is swapped in.
* The emptyDir (`trivy.dbSizeLimit`, 5Gi) holds the current copy and the next one.
* A download dir left by a container restart is removed before the next download.
* After a restart, a database downloaded less than a day ago is used as is. It is not fetched again.
`results.db` has one table, `results`, with one row per digest. Its columns are `digest`, `scanned_at`, `next_at`, `err_reason`, and `findings` and `vulns` as JSON. Rows are dropped once they are a week past their next scan time.
Entity diagrams of both SQLite files are in the OpenSpec specs:
* `results.db` in [image-scanning](https://github.com/Rishang/xeol-operator/blob/main/openspec/specs/image-scanning/spec.md#data-model)
* `xeol.db` in [eol-database](https://github.com/Rishang/xeol-operator/blob/main/openspec/specs/eol-database/spec.md#data-model)
## Failure handling
[Section titled “Failure handling”](#failure-handling)
| Situation | What happens |
| ------------------------------------------ | ------------------------------------------- |
| Registry auth, image not found, timeout | Recorded with a reason; retried after 1h |
| trivy step fails (syft and xeol succeeded) | Reason `trivy`; retried after 1h |
| A scan runs the pod out of memory | Skipped for 24h, or rescanned alone first |
| endoflife.date unreachable | The current database stays in use |
| Container restart | Only overdue digests are rescanned |
| New pod (upgrade, reschedule) | Database rebuilt; every image scanned again |
The details for each case:
* **Registry auth, image not found, timeout:** the reason is `auth`, `not_found`, `timeout` or `other`. It is counted in `xeol_scan_errors_total`. The previous findings are kept until the retry after 1h.
* **trivy step fails:** the new EOL findings are kept, and the previous vulnerabilities stay.
* **Out of memory:** the container restarts and finds the digest’s in-flight marker.
* If that scan was running alone, the digest is skipped for 24h with reason `oom`, instead of crash-looping.
* If other scans were running too, it is rescanned alone first to find the culprit.
* **endoflife.date unreachable:** if there is no database yet, the pod stays unready and scans wait.
* **Container restart:** the Inventory is rebuilt from Pods, and results are restored from `results.db`.
* **New pod:** all volumes are emptyDirs, so nothing carries over.
## Leader election and replicas
[Section titled “Leader election and replicas”](#leader-election-and-replicas)
The chart runs one replica with leader election on. Leader election means that, when several replicas run, only one (the leader) does the work at a time.
* The Pod controller and the scan queue run only on the leader. So only the leader has an Inventory.
* Every replica reads the config file.
* A standby still builds its own EOL database, so it can take over.
* A standby answers `503` on the JSON API, the web page and MCP.
* Metrics on a standby contain only the database build time and empty scan counters.
## Security
[Section titled “Security”](#security)
* **RBAC is read-only.** The operator has get/list/watch on Pods, Namespaces, Nodes, ServiceAccounts and the apps/batch workload kinds, and `get` on Secrets. The config file comes from a mounted volume, so it needs no API access. The operator creates nothing in the cluster.
* **Pull secrets are handled briefly.** They are read one `get` at a time when a scan starts. They are never cached or listed. They are written to a `0600` file in that scan’s temp dir and deleted with it. They are never logged.
* **The container is locked down.** It runs as non-root with a read-only root filesystem. Every writable path is one of the emptyDirs above.
* **There is no login.** The web page, MCP and JSON API have no login. Reach them with `port-forward`, and keep them off public Ingress.
* **Rescans need pod access.** `manager rescan` uses a listener bound to loopback, so the Kubernetes permission to `exec` into the pod decides who may rescan. The MCP `rescan` tool is off unless `mcp.allowRescan` is set. Everything else on port 8080 is read-only.
## Design choices
[Section titled “Design choices”](#design-choices)
* **Digest, not tag or PodSpec.** The digest in `imageID` is exactly what runs.
* A re-pushed tag is caught as soon as Pods restart.
* A template change that keeps the image (env, resources) costs nothing.
* An image shared by many workloads is scanned once.
* **In-process scans, not Jobs.** syft and xeol are bundled in the operator image and run as subprocesses. There are no Jobs, temp Secrets or log scraping. The trade-off: one pod’s CPU and memory limit how many scans run at once.
* **Running Pods only.** Old ReplicaSets and unused templates are never scanned. CronJob images are only exported while a run’s Pod exists.
* **Metrics built on scrape.** There is nothing to reconcile or delete when images stop running. A restart can’t leave stale series.
* **EOL data built locally.** xeol is only the matcher. The database comes from endoflife.date. It also covers distros (Debian, Alpine, Ubuntu) that xeol’s own database misses.